Download
1 / 18
180 likes | 335 Views
Monté Carlo Simulation. MGS 3100 – Chapter 9. Simulation Defined. A computer-based model used to run experiments on a real system. Typically done on a computer. Determines reactions to different operating rules or change in structure.

E N D
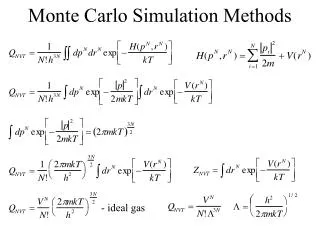
Monté Carlo Simulation MGS 3100 – Chapter 9
Simulation Defined A computer-based model used to run experiments on a real system. • Typically done on a computer. • Determines reactions to different operating rules or change in structure. • Can be used in conjunction with traditional statistical and management science techniques (such as waiting line problems, when the basic assumptions do not hold, or where problems involve multiple phases).
Differences Between Optimization and Simulation Optimization models • Yield decision variables as outputs • Promise the best (optimal) solution to the model Simulation models • Require the decision variables as inputs • Give only a satisfactory answer
Types of Simulation Models • Continuous • Based on mathematical equations. • Used for simulating continuous values for all points in time. • Example: The amount of time a person spends in a queue. • Discrete • Used for simulating specific values or specific points. • Example: Number of people in a waiting line (queue).
Simulation Methodology: • Estimate probabilities of future events • Assign random number ranges to percentages (probabilities) • Obtain random numbers • Use random numbers to “simulate” events.
Data Collection and Random Number Interval Example Suppose you timed 20 athletes running the 100-yard dash and tallied the information into the four time intervals below. You then count the tallies and make a frequency distribution. Then convert the frequencies into percentages. Finally, use the percentages to develop the random number intervals. Seconds 0-5.99 6-6.99 7-7.99 8 or more Tallies Frequency 4 10 4 2 % 20 50 20 10 RN Intervals 01-20 21-70 71-90 91-100
Sources of Event Probabilities and Random Numbers Event Probabilities • From historical data (assuming the future will be like the past) • From expert opinion (if the future will be unlike the past, or no data is available) Random Numbers • From probability distributions that ‘fit’ the historical data or can be assumed (use Excel functions) • From manual random number tables • From your instructor (for homework and tests, so we all get the same answer!)
Probability Distributions A probability distribution defines the behavior of a variable by defining its limits, central tendency and nature • Mean • Standard Deviation • Upper and Lower Limits • Continuous or Discrete Examples are: • Normal Distribution (continuous) • Binomial (discrete) • Poisson (discrete) • Uniform (continuous or discrete) • Custom (create your own!)
Normal Distribution • Conditions: • Uncertain variable is symmetric about the mean • Uncertain variable is more likely to be in vicinity of the mean than far away • Use when: • Distribution of x is normal (for any sample size) • Distribution of x is not normal, but the distribution of sample means (x-bar) will be normally distributed with samples of size 30 or more (Central Limit Theorem) • Excel function: NORMSDIST() – returns a random number from the cumulative standard normal distribution with a mean of zero and a standard deviation of one [e.g., NORMSDIST(1) = .84]
Uniform Distribution • All values between minimum and maximum occur with equal likelihood • Conditions • Minimum Value is Fixed • Maximum Value is Fixed • All values occur with equal likelihood • Excel function: RAND() – returns a uniformly distributed random number in the range (0,1)
Note on Random Numbers in Excel Spreadsheets • Once entered in a spreadsheet, a random number function remains “live.” A new random number is created whenever the spreadsheet is re-calculated. To re-calculate the spreadsheet, use the F9 key. Note, almost any change in the spreadsheet causes the spreadsheet to be recalculated! • If you do not want the random number to change, you can freeze it by selecting: tools, options, calculations, and checking “manual.”
Evaluating Results • Conclusions depend on the degree to which the model reflects the real system • The only true test of a simulation is how well the real system performs after the results of the study have been implemented.
Simulation Applications • Machine Breakdown problems • Queuing problems • Inventory problems • Many other applications
Many Computer Games Are Simulations! SimCity, SimFarm, SimIsle, SimCoaster, and others in this family of games have elaborate Monte Carlo models underlying the game exterior. Microsoft has recently released Train Simulator, for which there are numerous additional scenarios available on the Internet. Strategy games such as Civilization and Railroad Tycoon are also based on simulation modeling. Most of these games contain editors, in which the user can create new scenarios, new terrain, and even control the likelihoods of events.
Advantages of Simulation • Simulation often leads to a better understanding of the real system. • Years of experience in the real system can be compressed into seconds or minutes. • Simulation does not disrupt ongoing activities of the real system. • Simulation is far more general than mathematical models. • Simulation can be used as a game for training experience (safety!).
Simulation Advantages (cont’d) • Simulation can be used when data is hard to come by. • Simulation can provide a more realistic replication of a system than mathematical analysis. • Simulation can be used to analyze transient conditions, whereas mathematical techniques usually cannot. • Simulation considers variation and can calculate confidence intervals of model results.
Simulation Advantages (cont’d) • Simulation can model a system with multiple phases • Simulation can model a system when it is already in a steady-state (i.e., can initialize the system with the beginning queue, beginning inventory, etc.!). • Simulation can also test a “range” of inputs to perform what-if/sensitivity analysis. • Many standard simulation software packages are available commercially (and Excel works fine too!).
Disadvantages of Simulation • There is no guarantee that the model will, in fact, provide good answers. • There is no way to prove reliability. • Simulation may be less accurate than mathematical analysis because it is randomly based. • Building a simulation model can take a great deal of time (but if the payoff is great, then it is worth it!). • A significant amount of computer time may be needed to run complex models (old concern - no longer an issue!). • The technique of simulation still lacks a standardized approach.