Download
1 / 1
10 likes | 267 Views
Std Conc. n Mean Std %CV %Recovery (ng/mL) Midazolame 20 3 21.4 2.8 12.9 107 200 3 211 9.9 4.7 105 2000 3 1947 186 9.5 97.3 Oxazepam 20 3 18.1 0.8 4.3 90.7 200 3 190 5.5 2.9 95.2 2000 3 1842 52.0 2.8 92.1 Diltiazem 20 3 19.8 1.6 7.9 98.8

E N D
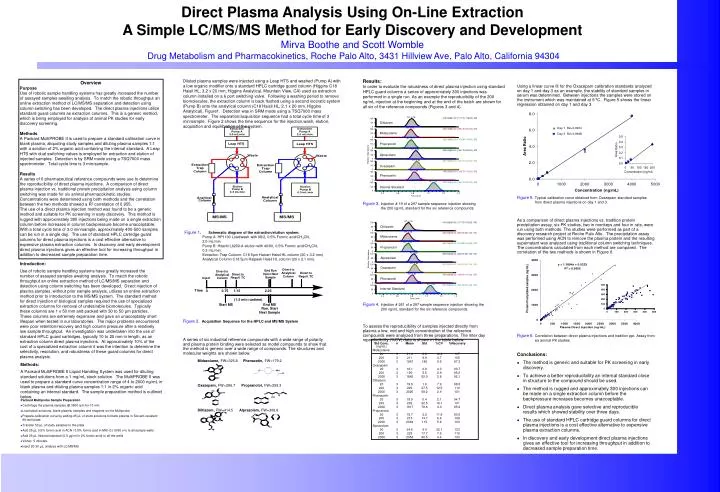
Std Conc. n Mean Std %CV %Recovery (ng/mL) Midazolame 20 3 21.4 2.8 12.9 107 200 3 211 9.9 4.7 105 2000 3 1947 186 9.5 97.3 Oxazepam 20 3 18.1 0.8 4.3 90.7 200 3 190 5.5 2.9 95.2 2000 3 1842 52.0 2.8 92.1 Diltiazem 20 3 19.8 1.6 7.9 98.8 200 3 220 27.5 12.5 110 2000 3 2025 59.2 2.9 101 Phenacetin 20 3 18.9 0.4 2.1 94.7 200 3 202 32.5 16.1 101 2000 3 1917 76.6 4.0 95.9 Propranolol 20 3 18.7 2.2 11.8 93.6 200 3 215 14.7 6.8 108 2000 3 2064 115 5.6 103 Alprazolam 20 3 24.6 5.4 22.1 123 200 3 223 17.7 7.9 112 2000 3 2054 90.5 4.4 103 Diltiazem Midazolame Propranolol Alprazolam Oxazepam Phenacetin Internal Standard RT: 0.75 100 415.00@27.00 [ 177.75-178.25] MS 50 0 RT: 0.75 326.00@30.00 [ 290.75-291.25] MS 100 Diltiazem 50 0 RT: 0.74 260.10@22.00 [ 115.95-116.45] MS 100 Midazolame 50 0 RT: 0.82 309.00@30.00 [ 280.75-281.25] MS 100 Propranolol 50 Relative Abundance 0 RT: 0.83 287.00@30.00 [ 240.75-241.25] MS 100 Alprazolam 50 0 RT: 0.80 180.00@25.00 [ 109.75-110.25] MS 100 Oxazepam 50 0 RT: 1.05 397.00@16.00 [ 300.75-301.25] MS 100 Phenacetin 50 0 0.4 0.6 0.8 1.0 1.2 1.4 Time (min) Internal Standard RT: 0.78 415.00@27.00 [ 177.75-178.25] MS 100 50 0 RT: 0.76 326.00@30.00 [ 290.75-291.25] MS 100 50 0 RT: 0.77 260.10@22.00 [ 115.95-116.45] MS 100 50 0 RT: 0.82 309.00@30.00 [ 280.75-281.25] MS 100 Relative Abundance 50 0 RT: 0.84 287.00@30.00 [ 240.75-241.25] MS 100 50 0 RT: 0.81 180.00@25.00 [ 109.75-110.25] MS 100 Midazolame, FW=325.8 Phenacetin, FW=179.2 Oxazepam, FW=286.7 Propranolol, FW=259.3 Diltiazem, FW=414.5 Alprazolam, FW=308.8 50 0 RT: 1.07 397.00@16.00 [ 300.75-301.25] MS 100 50 0 0.4 0.6 0.8 1.0 1.2 1.4 Time (min) Direct Plasma Analysis Using On-Line ExtractionA Simple LC/MS/MS Method for Early Discovery and DevelopmentMirva Boothe and Scott Womble Drug Metabolism and Pharmacokinetics, Roche Palo Alto, 3431 Hillview Ave, Palo Alto, California 94304 Diluted plasma samples were injected using a Leap HTS and washed (Pump A) with a low organic modifier onto a standard HPLC cartridge guard column (Higgins C18 Haisil HL, 3.2 x 20 mm, Higgins Analytical, Mountain View, CA) used as extraction column installed on a 6 port switching valve. Following a washing period to remove biomolecules, the extraction column is back flushed using a second isocratic system (Pump B) onto the analytical column (C18 Haisil HL, 2.1 x 20 mm, Higgins Analytical), Figure1. Detection was in SRM mode using a TSQ7000 mass spectrometer. The separation/acquisition sequence had a total cycle time of 3 min/sample. Figure 2 shows the time sequence for the injection,wash, elution, acquisition and equilibration of the system. Results: In order to evaluate the robustness of direct plasma injection using standard HPLC guard columns a series of approximately 300 injections was performed in a single run. As an example the reproducibility of the 200 ng/mL injection at the beginning and at the end of the batch are shown for all six of the reference compounds (Figures 3 and 4). Overview Purpose Use of robotic sample handling systems has greatly increased the number of assayed samples awaiting analysis. To match the robotic throughput an online extraction method of LC/MS/MS separation and detection using column switching has been developed. The direct plasma injections utilize standard guard columns as extraction columns. This is a generic method, which is being employed for analysis of animal PK studies for early discovery screening. Methods A Packard MultiPROBE II is used to prepare a standard calibration curve in blank plasma, aliquoting study samples and diluting plasma samples 1:1 with a solution of 2% organic acid containing the internal standard. A Leap HTS with dual switching valves is employed for extraction and elution of injected samples. Detection is by SRM mode using a TSQ7000 mass spectrometer. Total cycle time is 3 min/sample. Results A series of 6 pharmaceutical reference compounds were use to determine the reproducibility of direct plasma injections. A comparison of direct plasma injection vs. traditional protein precipitation analysis using column switching was made for six animal pharmacokinetic studies. Concentrations were determined using both methods and the correlation between the two methods showed a R2 correlation of 0.955. The use of a direct plasma injection method was found to be a generic method and suitable for PK screening in early discovery. This method is rugged with approximately 300 injections being made on a single extraction column before increases in column backpressure become unacceptable. With a total cycle time of 3.0 min/sample, approximately 400-500 samples can be run in a single day. The use of standard HPLC cartridge guard columns for direct plasma injections is a cost effective alternative to expensive plasma extraction columns. In discovery and early development direct plasma injections gives an effective tool for increasing throughput in addition to decreased sample preparation time. Using a linear curve fit for the Oxazepam calibration standards analyzed on day 1 and day 3 as an example, the stability of standard samples in serum was determined. Between injections the samples were stored on the instrument which was maintained at 9 ºC. Figure 5 shows the linear regression obtained on day 1 and day 3. Figure 5.Typical calibration curve obtained from Oxazepam standard samples from direct plasma injections on day 1 and 3. Figure 3.Injection # 19 of a 297 sample sequence injection showing the 200 ng/mL standard for the six reference compounds. As a comparison of direct plasma injections vs. tradition protein precipitation assay, six PK studies, two in monkeys and four in rats, were run using both methods. The studies were performed as part of a discovery research project at Roche Palo Alto. The precipitation assay was performed using ACN to remove the plasma protein and the resulting supernatant was analyzed using traditional column switching techniques. The concentrations calculated from each method are compared. The correlation of the two methods is shown in Figure 6. Figure 1.Schematic diagram of the extraction/elution system. Pump A: HP1100 Load/wash with 98/2, 0.5% Formic acid/CH3CN, 2.0 mL/min Pump B: Hitachi L6200-A elution with 40/60, 0.5% Formic acid/CH3CN, 0.3 mL/min. Extraction Trap Column: C18 5µm Haicart Haisil HL column (20 x 3.2 mm) Analytical Column C18 5µm Haipeek Haisil HL column (20 x 2.1 mm). Introduction: Use of robotic sample handling systems have greatly increased the number of assayed samples awaiting analysis. To match the robotic throughput an online extraction method of LC/MS/MS separation and detection using column switching has been developed. Direct injection of plasma samples, without prior sample analysis, utilizes an online extraction method prior to introduction to the MS/MS system. The standard method for direct injection of biological samples required the use of specialized extraction columns for removal of undesirable biomolecules. Typically these columns are 1 x 50 mm and packed with 30 to 50 µm particles. These columns are extremely expensive and gave an unacceptably short lifespan when tested in our laboratories. The major problems encountered were poor retention/recovery and high column pressure after a relatively low sample throughput. An investigation was undertaken into the use of standard HPLC guard cartridges, typically 10 to 20 mm in length, as an extraction column direct plasma injections. At approximately 10% of the cost of a specialized extraction column it was the intention to determine the selectivity, resolution, and robustness of these guard columns for direct plasma analysis. Figure 4.Injection # 261 of a 297 sample sequence injection showing the 200 ng/mL standard for the six reference compounds. Figure 2.Acquisition Sequence for the HPLC and MS/MS System To assess the reproducibility of samples injected directly from plasma a low, mid and high concentration of the reference compounds were analyzed from three preparations. The inter day reproducibility (%CV) data is shown in the table below. Figure 6.Correlation between direct plasma injections and tradition ppt. Assay from six animal PK studies. A series of six industrial reference compounds with a wide range of polarity and plasma protein binding were selected as model compounds to show that the method is generic over a wide range of compounds. The structures and molecular weights are shown below. Conclusions: • The method is generic and suitable for PK screening in early discovery. • To achieve a better reproducibility an internal standard close in structure to the compound should be used. • The method is rugged and approximately 300 injections can be made on a single extraction column before the backpressure increases becomes unacceptable. • Direct plasma analysis gave selective and reproducible results which showed stability over three days. • The use of standard HPLC cartridge guard columns for direct plasma injections is a cost effective alternative to expensive plasma extraction columns. • In discovery and early development direct plasma injections gives an effective tool for increasing throughput in addition to decreased sample preparation time. Methods: A Packard MultiPROBE II Liquid Handling System was used for diluting standard solutions from a 1 mg/mL stock solution. The MultiPROBE II was used to prepare a standard curve concentration range of 4 to 2000 ng/mL in blank plasma and diluting plasma samples 1:1 in 2% organic acid containing an internal standard. The sample preparation method is outlined below. Packard Multiprobe Sample Preparation • Centrifuge the plasma samples @ 3800 rpm for 10 min. • Load stock solutions, blank plasma, samples and reagents on the Multiprobe • Prepare calibration curve by adding 25 µL of stock solutions to blank plasma in Solvent-resistant 96-well plate. • Transfer 50 µL of study samples to the plate. • Add 25 µL 0.5% formic acid in ACN / 0.5% formic acid in Milli-Q (10/90 v/v) to all sample wells. • Add 25 µL Internal standard (0.5 µg/ml in 2% formic acid) to all the wells • Vortex 5 minutes. • Inject 20-30 µL, analyze with LC/MS/MS