Download
1 / 11
120 likes | 259 Views
Hurricane Visualizations: Modeling Conceptual Change. ESPIRIT II: SV Saturday, March 7 th , 2009. Phase 1: Brainstorm – 5 minutes.

E N D
Hurricane Visualizations: Modeling Conceptual Change ESPIRIT II: SV Saturday, March 7th, 2009
Phase 1: Brainstorm – 5 minutes • Individually, describe the formation and characteristics (e.g., size, season, features, movement, etc.) of Atlantic basin hurricanes using text descriptions and diagrams on the notepad provided • Please print your name in the upper corner of the notepad
Phase II: Collaboration – 5 minutes • Self-aggregate into groups of 3 or 4 based on grade level or content area • Using phase I product, develop a mutually acceptable group representation of hurricane development and characteristics • Select one group member’s notebook to record your understanding – Label as Phase II
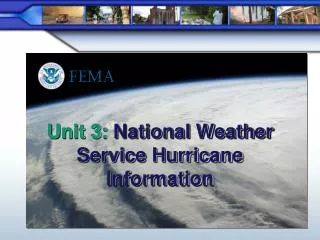
Phase III: Web-based Visualizations • Multiple Grade Levels – impact selection • http://scifiles.larc.nasa.gov/kids/Problem_Board/problems/weather/hurricanebasics.swf • http://www.nhc.noaa.gov/HAW2/english/kids/movncane.swf • http://www.usatoday.com/weather/graphics/hurricane/hurricane_explainer/flash.htm • http://www.cbsnews.com/htdocs/natural_disasters/hurricanes/framesource_flash.html • http://news.bbc.co.uk/1/hi/sci/tech/4588149.stm • http://learners.gsfc.nasa.gov/mediaviewer/27storms/
Phase IV: Modification – 5 minutes • As a group, supplement, delete or modify your Phase II product on a new page in the notebook • Record in the Phase II notebook and label as Phase IV
Phase V: Target Model Example • Grade Level – intro undergrad • Formation • Warm water - >80/81/82 to depth 100 m/200 m • unstable air • Coriolis Force – 5 degrees N and S of Equator • spin • Weak Vertical Wind Shear • humid air aloft • Organizational Trigger • airmassfront, easterly wave, ITCZ convection
Phase V: Target Model Example • Stages • Tropical depression - numbered • <38 mph (<33 kt) • Tropical storm - named • 39-73 mph (34-63 kt) • Hurricane • > 73 mph (64 kt) • Structure • Eye • Avg 300 miles wide, 20-40 miles, calm • Eyewall • Dense convection, highest winds • Spiral bands • dense bands of thunderstorms ranging from a few miles to tens of miles wide and 50 to 300 miles long
Phase V: Target Model Example • Season: June 1-November 30 • Movement - hurricane's speed and path depend on complex ocean and atmospheric interactions, complexity of the flow makes it very difficult to predict the speed and direction of a hurricane. • Trade winds, Westerlies, STH, Fronts • Conditions • Hurricane-force winds can extend outward to about 25 miles in a small hurricane and to more than 150 miles for a large one. Tropical storm-force winds can stretch out as far as 300 miles from the center of a large hurricane • Worst impacts – right side
Phase V: Target Model Example • Categorization – Saffir-Simpson • More…min, max, history…
Phase V: Target Model Example – 5 minutes • As group assess your Phase IV product with Target Model on new page in notebook • Label page Phase V
Phase VI: Selection Criteria and Implementation Considerations – 10 minutes • Based on this experience, individually, develop global criteria for selecting visualizations for use during instructional • Record criteria in your notebook and label page Phase VI • Lastly, consider pedagogical implications for the use of visualizations in your classroom • Record positive and negative implications for use


![Data Modeling [Comparison of data modeling techniques ]](https://cdn0.slideserve.com/205866/data-modeling-comparison-of-data-modeling-techniques-dt.jpg)