Download
1 / 16
160 likes | 364 Views
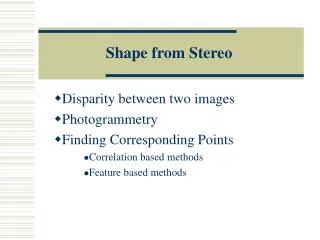
Robust Wide Baseline Stereo from Maximally Stable Extremal Region. J. Matas, O Chum, M. Urban, T. Pajdle BMVC 2002. Introduction. Objective : Finding correspondences in two images. An enabling step toward many applications. Distinguished Regions. Maximally Stable Extremal Regions.

E N D
Robust Wide Baseline Stereo from Maximally Stable Extremal Region J. Matas, O Chum, M. Urban, T. Pajdle BMVC 2002
Introduction Objective: Finding correspondences in two images. • An enabling step toward many applications.
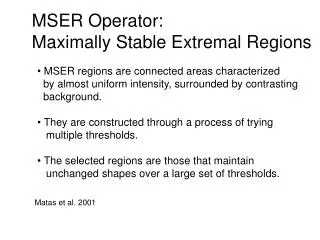
Maximally Stable Extremal Regions Distinguished Regions • Stability • Adjacency preserving • Invariance to affine • Multi-scale detection
Extremal/Maximal Regions g=0.2 g=0.4 g=0.9 Definition: A set of all connected components (pixels) below all thresholds.
Extremal/Minimal Regions g=0.2 g=0.4 g=0.9 Definition: A set of all connected components (pixels) above all thresholds.
Maximally Stable Extremal Regions Stable Regions: An extremal region stays virtually unchanged over a range threshold.
Maximally Stable Extremal Regions Descriptor Location of intensity maximum/minimum, Threshold. Measurement region Ellipse, circle, rectangular image patches, contours. Similarity Mohalanobis distance, correlation, etc.
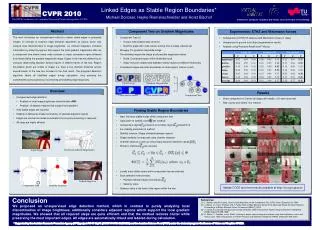
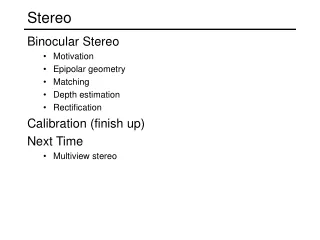
Epipolar Geometry (EG) Saliency Detection Region Matching Rough Affine Refine EG
Applications Estimation of Epipolar Geometry
Applications Tracking of license plates
Applications Face tracking Pixels of color image are ordered by Mahananobis distance to the estimated skin-tone Gaussian distribution in R-G space.
Remarks • Stable salient point/regions detection. • Application in epipolar geometry and tracking. • Potential feature transform descriptor.