Download
1 / 39
390 likes | 571 Views
Seasonal & Daily Temperatures. This chapter discusses: The role of Earth's tilt, revolution, & rotation in causing local, seasonal, & daily temperature variations Methods & tools for measuring temperature.

E N D
Seasonal & Daily Temperatures • This chapter discusses: • The role of Earth's tilt, revolution, & rotation in causing local, seasonal, & daily temperature variations • Methods & tools for measuring temperature
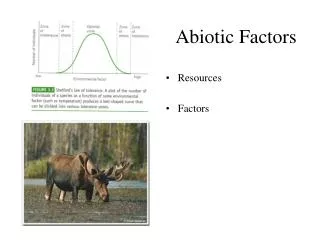
Four factors that determine how much radiation is received by the Earth at a given location: • Sphericity of the Earth • Axial Tilt • Elliptical Orbit of The Earth • Daily Earth Rotation
Seasons & Sun's Distance Earth's surface is 5 million kilometers further from the sun in summer than in winter, indicating that seasonal warmth is controlled by more than solar proximity.
Seasons & Solar Intensity • Solar intensity, defined as the energy per area, governs earth's seasonal changes. • A common unit for solar intensity is Watts per meter square (Wm-2). The solar intensity hitting directly at the top of the atmosphere is about 1380 Wm-2. • A sunlight beam that strikes at an angle is spread across a greater surface area, and is a less intense heat source than a beam impinging directly.
Solstice & Equinox Equal Amount Direct Sunlight at 23.5°S Direct Sunlight at 23.5°N Equal Amount • Earth's tilt of 23.5° and revolution around the sun creates seasonal solar exposure and heating patterns. • A solstice tilt keeps a polar region with either 24 hours of light or darkness. • A equinox tilt perfectly provides 12 hours of night and 12 hours of day for all non-polar regions.
24 Hours of Daylight During the summer, north of the arctic circle reveals a period of 24 hour sunlight, where the earth's surface does not rotate out of solar exposure, but instead experiences a midnight sun.
Earth's Tilt & Atmosphere 23.5 • Earth's atmosphere reduces the amount of incoming solar radiation (insolation) striking earth's surface. • This figure shows the insolation for the top of the atmosphere and the surface of the earth on the summer solstice. • So insolation is larger at 30° than 23.5° even though the sun is directly overhead why? • more moisture and daylight
Earth's Tilt • Earth's atmosphere and tilt combine to explain variation in received solar radiation. • Notice the difference between the top and bottom of the atmosphere at different latitudes.
March 20th • Vernal Equinox • June 21st • Summer Solstice • Sept 22nd • Autumnal Equinox • Dec 21st • Winter Solstice
Earth's Unequal Heating • This figure shows the relative amount of solar radiation received at the earth’s surface from 90 °S to 90°N on the winter solstice. • Insolation is not evenly distributed across all lines of latitude, creating a heating imbalance.
Earth's Energy Balance • This figure illustrates the average annual incoming solar radiation absorbed and outgoing infrared radiation from the earth and the atmosphere. • Earth's annual energy balance between solar insolation and terrestrial infrared radiation is achieved locally at only two lines of latitude. • A global balance is maintained by excess heat from the equatorial region transferring toward the poles. • So basically, the surplus heat from the tropically region is transported to the pole regions where deficit exists.
Longer Northern Spring & Summer Faster Slower • Earth reaches its greatest distance from the sun during a northern summer, and this slows its speed of revolution. • The outcome is a spring and summer season 7 days longer (Mar 20 to Sept 22) than that experienced by the southern hemisphere.
Local Solar Changes • The apparent path of the sun across the sky as observed at different latitudes during the solstices and equinoxes. • Summer noon time sun in the northern mid-latitudes is also higher above the horizon than the winter sun.
Daytime Warming (daily temperature variation) • Solar radiation heats the atmosphere from below by soil conduction and gas convection. • Compare temperature profiles between Windy and calm days near the surface – do you see the difference? Windless Day • Large temperature change in the lowest layer by conduction Vertical Mixing • Winds create a “forced convection” of vertical mixing that diminishes steep temperature gradients.
The maximum intensity of solar rays peaks around noon but the daily high temperature is usually observed later in the afternoon. So why the discrepancy? Temperature Lag • Earth's surface temperature is a balance between incoming solar radiation and outgoing terrestrial radiation. • Peak temperature lags after peak incoming solar energy because earth continues to warm until infrared radiation exceeds incoming solar energy. • The highest temperature reading usually occurs between 3 – 5 P.M. local time. • Orographic effect can play a role in max temp (i.e. Denver). Air Temperature rises Air Temperature falls
Just how warm the air heats up depend on: • Type of soil • Sand is a poor conductor of heat which helps to heat the atmosphere even further • Moisture Content • More energy is used to evaporate the water and less is being used to heat the atmosphere • Vegetation cover • Forest Canopy versus corn field versus open grass field • Humidity • Along with haze and cloudiness tends to lower maximum temperature by preventing some of the sun’s rays from reaching the ground
Nighttime Cooling Calm Night Vertical Mixing • Earth's surface has efficient radiational cooling, which creates a temperature inversion that may be diminished by winds. • Earth's nighttime cooling is influence by: • 1) evening length, • 2) water vapor • 3) clouds • 4) vegetation affect
Cold Dense Air Warm Warm Cold • Nighttime radiational cooling increases air density. • Air density is related temperature under the ideal gas law. • Pressure = density × gas constant × temperature • On hill slopes, denser air settles to the valley bottom, creating a thermal belt of warmer air between lower and upper cooler air.
The image to the left shows how the temperature near the ground can change dramatically in a 24 hour time span. This example is for a a grass field on a clear, calm summer day over a city in the US. Although the greatest temperature observed is associated with the “noon” temperature profile but the warmest temperature profile two feet above the ground is the “3 PM” temperature profile.
Protecting Crops from Below Impacts of radiational cooling can be diminished by orchard heaters creating convection currents to warm from below and by wind machines mixing warmer air from above.
Protecting Crops from Above • Crops subjected to below freezing air are not helped by convection or mixing, but by spraying water. • The cold air uses much of its energy to freeze the water, leaving less to take temperatures below 0°C that damage the crop.
Factors Controlling the Temperature Earth's air temperature is governed by length of day and intensity of Sun’s energy, which are a function of: Latitude (Primary) 2) Land and water (Secondary) 3) Ocean currents (Secondary) 4) Elevation (Secondary)
January Global Isotherms Latitudes determine that earth's air temperatures are warmer at the equator than at the poles, but land/water, ocean currents, and elevation create additional variations.
July Global Isotherms The southern hemisphere has fewer land masses and more ocean currents that encircle the globe, creating isotherms that are more zonal than those in the northern hemisphere.
Water has a higher specific heat than land. • Specific heat - is the amount of heat a substance needs to raise the temperature of one gram by one degree Celsius. • Water not only heats slower but it also cools slower as well. • Oceans and Large Lakes act as heat reservoirs.
Air Temperature • There are several ways to present air temperature data with respect to climate: • Daily • Monthly • Yearly • From these 3 climatological values, air temperature can be subcategorized into 4 groups: • Range: maximum minus minimum • Mean: average of temperature observations • Maximum: highest temperature of time period • Minimum: lowest temperature of time period
Daily (Diurnal) Temperature Range • The greatest daily temperature variation occurs at the earth’s surface • Earth's surface efficiently absorbs solar energy and efficiently radiates infrared energy, creating a large diurnal temperature range (max/min) in the lower atmosphere. • Moisture can affect the diurnal temperature range. ~ 98 Floor building
Cloud Cover VS. Clear Skies • Cloud cover can play a vital role on impacting the daily air temperature. • Clouds are good absorber of IR but poor absorber of visible light. • Earth’s longwave radiation can escape through the atmosphere via the atmospheric window (8 – 11 μm).
Regional Temperatures Regional differences in temperature, from annual or daily, are influenced by: 1) geography, such as latitude, altitude 2) nearby water or ocean currents 3) heat generated in the urban area San Francisco, CA and Richmond, VA are located at 37ºN.
Continental interior areas, such as St. Louis Missouri, have large annual temperature variations. • Areas surrounding by a large body of water have smaller differences between the coldest and warmest monthly temperatures.
Use of Temperature Data • Heating degree-day • Based on the assumption that people will begin to use their furnaces when the mean daily temperature drops below 65 °F. • Determined by subtracting the average temperature of the day from 65 °F. • Example: If the mean high was 63 °F then the heating degree-day is 2. • Cooling degree-day • Based on the assumption that people will begin to use their air conditioners when the mean daily temperature rises above 65 °F. • Determined by subtracting 65 °F from the daily average temperature. • Growing degree-day • Based on the approximate number of days for a certain plant to fully grow for harvest. • Computed by using a base temperature where the plant can grow (daily mean temp - base temp).
Heating Degree Day 1 = 1000 ºF Temperature data are analyzed to determine when living space will likely be heated (e.g. when below 65 °F) and how much fuel is required for that region.
Cooling Degree Days 1 = 1000 ºF Daily temperature data are also used to determine cooling loads for living space above 65 °F, as well as growing hours for specific crops above a base temperature.
Sensible temperature - is the temperature that we perceive higher than a thermometer; often during calm cold days or nights. This is caused by the the thin layer of warm air molecules that forms close to the skin via conduction and convection • Wind Chill Index - how cold the wind makes us feel; the faster the wind, the greater the heat loss thereby making us feel colder. Human Comfort and Air Temperature
Measuring Air Temperature • Liquid-in-glass thermometer • Used for measuring surface air temperature; easy to read and cheap to make • Maximum thermometer • Similar to liquid-in-glass except it records the maximum temperature until it is manually deleted or surpassed • Minimum thermometer • Similar to liquid-in-glass except it records the minimum temperature; made out of alcohol due to its lower freezing level • Electrical thermometers (thermistor and electrical resistance thermometer) • Highly accurate; measure the electrical resistance of a particular material which is calibrated to represents the air temperature • Radiometer or infrared sensor • Do not make direct measurement but rather measure emitted radiation • Bimetallic thermometer • Contain 2 pieces of metal (usually iron and brass) welded together; as brass expands faster than iron in higher temperature causing the piece to bend; this bending determines air temperature; an important part of a thermograph (an instrument that measures and records temperature)