Download
1 / 26
260 likes | 434 Views
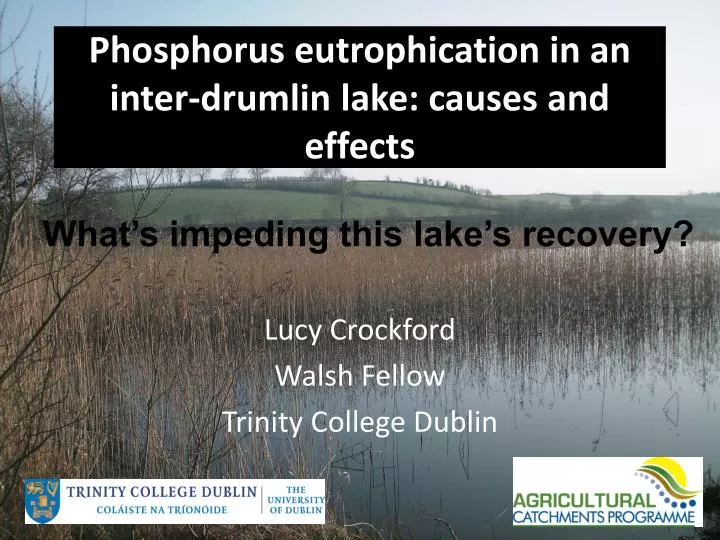
Phosphorus eutrophication in an inter-drumlin lake: causes and effects. What’s impeding this lake’s recovery?. Lucy Crockford Walsh Fellow Trinity College Dublin. Outline. Policy Pollution sources and eutrophication Work on the lake Results so far Interpretation. Policy. SI 272 2009.

E N D
Phosphorus eutrophication in an inter-drumlin lake: causes and effects What’s impeding this lake’s recovery? Lucy Crockford Walsh Fellow Trinity College Dublin
Outline • Policy • Pollution sources and eutrophication • Work on the lake • Results so far • Interpretation
Policy SI 272 2009 OECD and Tierney, 2008
Pollution Sources in Rural Catchments Unknown Diffuse Point
Internal Lake Sources Project Objective: To determine the main processes that are contributing to the increased P concentrations External P loads Internal P loads Wind induced resuspension in shallow areas Research Questions What are the main contributors of P? Which contributors are the primary factor in the impediment of lake recovery despite source recovery? How are the dynamics of the lake contributing to the P concentrations – biological, chemical, morphological, catchment use etc.? How can high frequency monitoring improve our understanding of lake dynamics particularly the impact of episodic events, DO fluctuations, and the signal of the Chl a sensor? Source: SØNdergaard et al., 2001
Work on the Lake Data Sondes – Chlorophyll a, conductivity, dissolved oxygen, temperature, redox, pH - hourly Manual sampling – P fractions, phytoplankton, zooplankton Bi-monthly Buoys
Weather and external loading Results so Far
Manual Sampling P fractions, Nitrate and Chl a
Conclusions • Lake is switching between meso and eutrophic status. • The external load of P is low - inline with source reduction? • Internal loading is occurring in anoxic water. • The lake suddenly mixing fertilises photic zone – May 2011 • Wind factor seems to not be increasing P concentrations at eastern end.
Future Work Chl a crash in spring not determined yet... Lack of Chl a response to high nutrients at end of summer during fine weather also not determined Quantify P loads and signal from sondes wrt chlorophyll a Draw conclusions on the factors impeding lake recovery.
References • SØNdergaard M, Jensen JP, Jeppesen E. Retention and internal loading of phosphorus in shallow, eutrophic lakes. TheScientificWorld 2001; 1: 427-442. • Tierney D. Water Quality of Lakes. State of the Environment in Ireland. Environmental Protection Agency, Johnstown Castle, Wexford, 2008. Acknowledgements • The Agricultural Catchments Programme, Teagasc • Profs Philip Jordan and David Taylor • Drs Alice Melland and Per-Erik Mellander • Mr John Kennedy • GLEON technical group
Hypotheses – Spring Chl a crash • Grazing pressure. • Lake overturning and “diluting” the Chlorophyll a concentration. • Reduction in available nutrients so population could not be sustained.
Hypotheses – Increased Deep Water SRP concentrations • Release from sediments aka internal loading. • External inputs from the catchment. • Wind induced resuspension of sediments.
Hypotheses – Increased Surface SRP concentrations at end of Summer • Lake overturning due to poor weather. • External loading from the catchment. • Wind induced resuspension.
Statistical Significance Testing N = 11 EAST WEST Lake Volume 1223389 m3 1 m Data Sonde 1 m Data Sonde Thermocline (6-7m) 9 m Data Sonde Abstraction (245684 m3yr-1) Lake Sediment Independent T test P = 0.9243 Difference in annual means is not statistically significant
Statistical Significance Testing N = 11 EAST WEST Lake Volume 1223389 m3 1 m Data Sonde 1 m Data Sonde Thermocline (6-7m) 9 m Data Sonde Abstraction (245684 m3yr-1) Independent T test P = 0.9609 Difference in annual means is not statistically significant Lake Sediment
Statistical Significance Testing N = 11 EAST WEST Lake Volume 1223389 m3 1 m Data Sonde 1 m Data Sonde Thermocline (6-7m) 9 m Data Sonde Abstraction (245684 m3yr-1) Lake Sediment Independent T test P = 0.9362 Difference in annual means is not statistically significant
Statistical Significance Testing N = 11 EAST WEST Lake Volume 1223389 m3 1 m Data Sonde 1 m Data Sonde Thermocline (6-7m) 9 m Data Sonde Abstraction (245684 m3yr-1) Independent T test P = 0.1752 Difference in annual means is not statistically significant – but p value much lower than other sample combinations Lake Sediment