Download
1 / 11
120 likes | 241 Views
An example of Alternative # 4 for P Charts With Variable Subgroup Sizes. The C Chart. Number of defects/unit data when there is a constant area of opportunity.

E N D
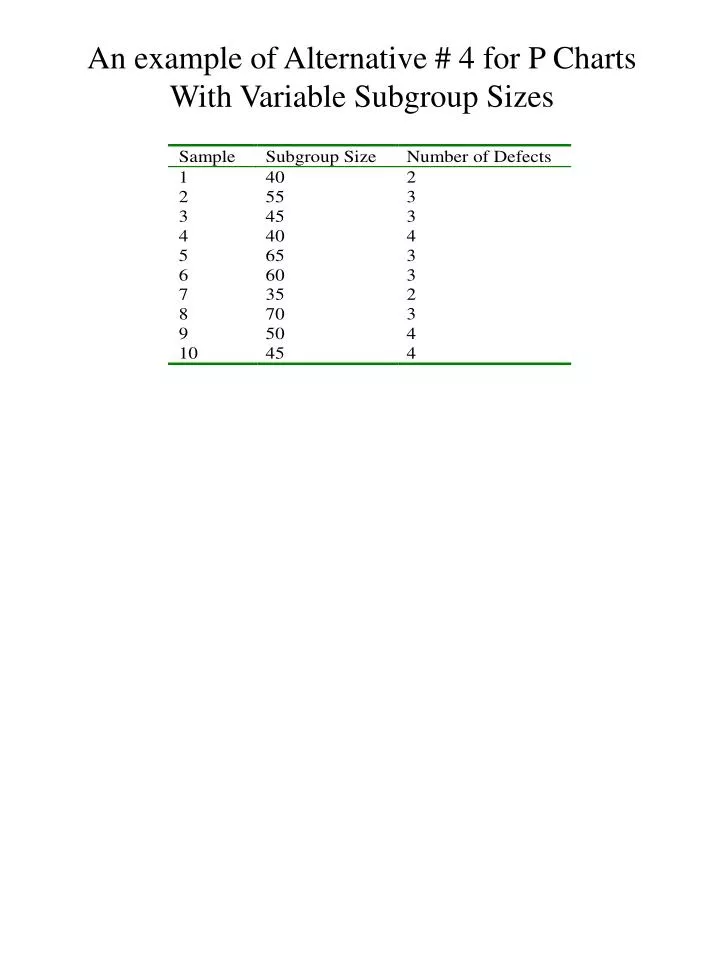
An example of Alternative # 4 for P Charts With Variable Subgroup Sizes
The C Chart • Number of defects/unit data when there is a constant area of opportunity. • Used for more complex products where there can be more than one defect present/unit (e.g., number of defects/car, number of defects/circuit board) • Control Limits:
For C charts the zones should be large enough to use zone rules (otherwise meaningless) • As a rule of thumb, the zone boundries should not be used for C charts with average counts of less than 20 • When average count is low the control chart may lead to overadustments (tampering) and underadjustments (too little sensitivity) • May use a set of fixed control limits (Probability Control Limits developed using the Poisson probability model) • See Figure 6.21, page 201 • Often leads to similar results as formula provides
Example The average number of surface imperfections in painted sheet metal pieces of equal size is 9. What are the Upper and lower control limits? Formula: Probability limits:
The U Chart • Number of defects/unit data when area of opportunity changes from subgroup to subgroup (e.g., number of defects in various types of circuit boards) • Control Limits: • Two alternatives for dealing with variable areas of opportunity: 1. Calculate approximate control limits based on average area of opportunity (most applicable when variation in subgroup size is less than ±25%) 2. Calculate two sets of control limits, inner and outer limits(most applicable when variation in subgroup size is more than ±25%)
Disadvantages of Attribute Charts • Difficult to make further improvements after a certain point. • Difficult to distinguish different sources of variation • Do not provide as clear a direction for process improvement as variables data.
Variable Control Charts • Range (R) Chart: Detects shifts in process variability • Control Limits:
Xbar (Mean) Chart: Detects shifts in process mean • Control limits:
Constructing Xbar and Range Control Charts I. Select about 25-50 samples of sizes 4 to 6 Use rational sampling: minimize variability within samples so variability across subgroups can be detected. II. Calculate the mean and Range of each sample III. Calculate the grand average (average of the averages) and the average of the ranges. IV. Calculate the control limits for the Xbar Chart, plot the sample ranges, eliminate any sample that indicates a special cause of variation, recalculate the control limits and repeat until no special causes of variation are present. V. Calculate the control limits for the Xbar chart, plot sample averages, eliminate any sample that indicates a special cause of variation, recalculate the control limits and repeat until no special causes of variation are present.
Consider a process by which coils are manufactured. Twenty five samples of Size 5 are randomly selected from the process over time and the resistance values (ohms) are measured. Construct an Xbar and Range Chart for this data. 1 20 22 21 23 22 2 19 18 22 20 20 3 25 18 20 17 22 4 20 21 22 21 21 5 19 24 23 22 20 6 22 20 18 18 19 7 18 20 19 18 20 8 20 18 23 20 21 9 21 20 24 23 22 10 21 19 20 20 20 11 20 20 23 22 20 12 22 21 20 22 23 13 19 22 19 18 19 14 20 21 22 21 22 15 20 24 24 23 23 16 21 20 24 20 21 17 20 18 18 20 20 18 20 24 22 23 23 19 20 19 23 20 19 20 22 21 21 24 22 21 23 22 22 20 22 22 21 18 18 17 19 23 21 24 24 23 23 24 20 22 21 21 20 25 19 20 21 21 22