Download
1 / 12
120 likes | 234 Views
LSSF Economic Impact on Electrical Power Generation. Report by: S. Clayton Palmer Clark D. Burbidge Western Area Power Administration. Upcoming Modeling Events. Stakeholder Review of Modeling Methods. May 2nd and 3rd Salt Lake City, Marriott City Center Seminar on CRSP Power Models.

E N D
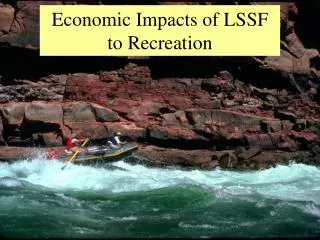
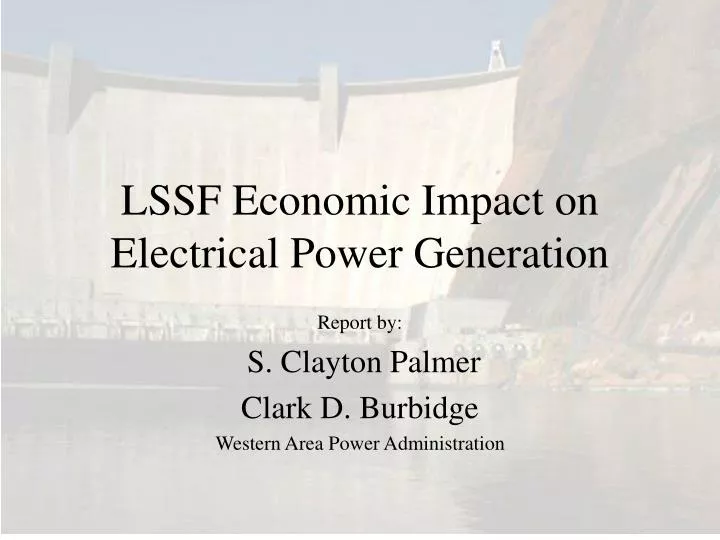
LSSF Economic Impact on Electrical Power Generation Report by: S. Clayton Palmer Clark D. Burbidge Western Area Power Administration
Upcoming Modeling Events • Stakeholder Review of Modeling Methods. • May 2nd and 3rd • Salt Lake City, Marriott City Center • Seminar on CRSP Power Models. • July • Chicago, Argonne National Laboratories
Hydro LP • Simulates water release for generation to meet customer load • Maximizes revenues and minimizes costs • Uses available water, market price, customer load, and unit environmental and operating constraints • Used to analyze impacts of proposed constraints • Forecasts available resources
Base Case Assumptions • USBR No Test Monthly Water Estimates • Glen Canyon Record of Decision • Normal Operations at other CRSP Units • CRSP Customer Pre-Schedule Demand • Average Hourly Purchase Prices
Test Case Assumptions • Actual Monthly Volume • Actual Hourly Release Pattern • Base Case Load • Base Case Prices • Base Case Operating Constraints
Comparison of Water Releases 1,200 1,000 800 1,000 AF 600 400 200 0 OCT NOV DEC JAN FEB MAR APR MAY JUN JUL AUG SEP OCT NOV DEC 1,051 1,060 1,009 805 649 648 907 1,130 474 493 495 656 606 803 826 Test 1,051 1,060 1,009 805 649 650 625 600 600 750 850 690 600 750 923 No Test
Questions? • Clayton Palmer • (801) 524-3522 • cspalmer@wapa.gov • Clark Burbidge • (801) 524-3582 • burbidge@wapa.gov