Download
1 / 21
210 likes | 302 Views
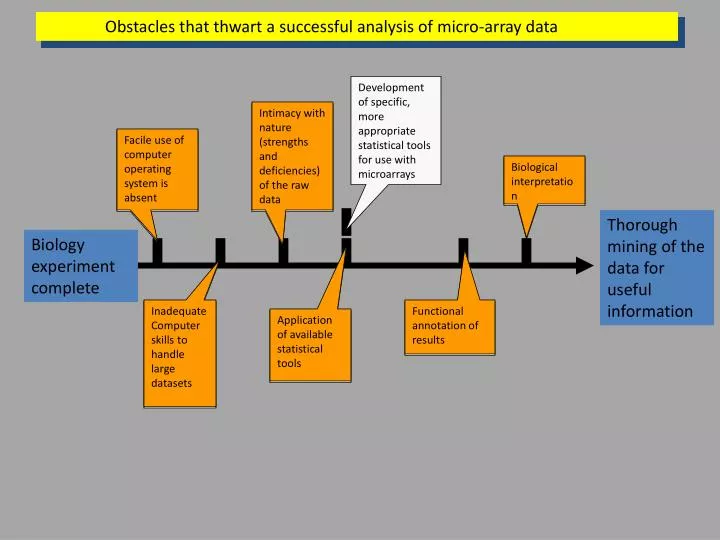
Intimacy with nature (strengths and deficiencies) of the raw data. Facile use of computer operating system is absent. Biological interpretation. Inadequate Computer skills to handle large datasets. Functional annotation of results. Application of available statistical tools.

E N D
Intimacy with nature (strengths and deficiencies) of the raw data Facile use of computer operating system is absent Biological interpretation Inadequate Computer skills to handle large datasets Functional annotation of results Application of available statistical tools Obstacles that thwart a successful analysis of micro-array data Development of specific, more appropriate statistical tools for use with microarrays Intimacy with nature (strengths and deficiencies) of the raw data Facile use of computer operating system is absent Biological interpretation Thorough mining of the data for useful information Biology experiment complete Inadequate Computer skills to handle large datasets Functional annotation of results Application of available statistical tools
Benefits of the Gene Array Approach 1. Interrogates thousands of genes. (12,000 55,000 28,869) 2. Versatile with respect to tissues. 3. Recently expanded beyond major biomedical research models. 4. Asks which genes are affected by a treatment? 5. Equivalent to 35,000 northern blots overnight. 6. Time course experiments gain immense value.
What is covered in this course? Data mining TotRNA Pattern mining Output as Affy.chp file Export as Text file Generate Affy.dat file Hybridize to Affy arrays Hyb. cRNAcocktail Pathway Analysis Case/UH Core Facility Illumina platform at CCF facility
WT Expression Array Design 11m 11m Probe Cell 5’ 3’ Validate using Blast and Tm Only PM used Perfect Match 25 mer DNA oligo Probe Set (<= 26 probes) Perfect Match Mismatch PM
cRNA preparation Total RNA (1-5 mg) AAAAAAAAA AAAAAAAAA cDNA Strand 1 synthesis TTTTTTTTTNNNNNNNNN T7RNA pol. promoter SS II reverse transcriptase E. coli DNA pol. I AAAAAAAAA NNNNN cDNA Strand 2 synthesis TTTTTTTTTNNNNNNNNN T7RNA pol. promoter IVT cRNA synthesis amplifies and labels transcripts with Biotin Fragmented cRNA T T T T TTTTTT T ……….. ……….. UUUUUUUUUU ……….. ……….. UUUUUUUUUU 1. Conversion to cRNA2. Amplification (linear)3. Labelling (biotin) ……….. UUUUUUUUUU UUUUUUUUUU UUUUUUUUUU AAAAAAAAAAAAAAN NNNNNNNNNNNNN NNNNNNNN T T T7 RNA pol. cRNA is now ready for hybridization to test chip
Chip is placed in a hybridization oven and incubatedovernight Chips are placed in the Fluidics station where they are washed, stained and washed again (2.5 hours) Affymetrix Array Chip After staining, the signal intensities are measured with a laser scanner (15 min) Data is acquired by the computer as soon as the scan has been completed. Sample is added to a hybridization cocktail along with spiked control transcripts and is loaded onto an array chip Hybridization cocktail
The first image is “sample1.dat.” note the pixel to pixel variation within a probe cell A “*.cel.” file is automatically generated when the “*.dat” image first appears on the screen. Note that this derivative file has homogenous signal intensity within its probe cells
How do we get the individual gene signals using RMA in EC? Sample 1 Sample 2 Sample 3 Gene 1 Average g1p3 g1p1 g2p1 g1p1 g1p1 g1p4 g2p4 g1p2 g1p2 g2p3 g1p2 g2p3 g1p2 g1p3 g1p3 g3p4 g1p3 g1p1 g3p1 g1p4 g1p4 g2p2 g1p4 g3p2 g3p2 g1p1 g2p2 g1p1 g3p1 g1p3 Gene 2 g2p1 g2p1 g2p1 g2p2 g3p3 g3p1 g2p2 g2p2 g2p2 g2p3 g2p4 g3p3 g2p3 g2p3 g2p3 g3p3 g1p3 g3p4 g2p4 g2p4 g2p4 g1p4 g1p2 g1p2 g2p1 g1p4 g2p1 Gene 3 g3p1 g3p1 g3p4 g3p1 g3p2 g2p4 g3p2 g3p2 g3p2 g3p3 g3p3 g3p3 g3p4 g3p4 g3p4 G G
Sample 1 Sample 2 Sample 3 Gene 1 g1p3 g1p1 g2p1 g1p1 g1p1 g1p4 g2p4 g1p2 g1p2 g2p3 g1p2 g2p3 g1p2 g1p3 g1p3 g3p4 g1p3 g1p1 g3p1 g1p4 g1p4 g2p2 g1p4 g3p2 g3p2 g1p1 g2p2 g1p1 g3p1 g1p3 Gene 2 g2p1 g2p1 g2p1 g2p2 g3p3 g3p1 g2p2 g2p2 g2p2 g2p3 g2p4 g3p3 g2p3 g2p3 g2p3 g3p3 g1p3 g3p4 g2p4 g2p4 g2p4 g1p4 g1p2 g1p2 g2p1 g1p4 g2p1 Gene 3 g3p1 g3p1 g3p4 g3p1 g3p2 g2p4 g3p2 g3p2 g3p2 g3p3 g3p3 g3p3 g3p4 g3p4 g3p4 G G
Sample 1 Sample 2 Sample 3 Gene 1 g1p1 g1p3 g2p1 g1p1 g1p1 g1p4 g1p2 g2p3 g1p2 g1p2 g2p4 g2p3 g1p3 g1p3 g3p4 g1p3 g1p2 g1p1 g1p4 g1p4 g2p2 g1p4 g3p1 g3p2 g3p2 g1p1 g2p2 120 95 216 300 112 150 50 110 150 g1p1 g3p1 g1p3 Gene 2 g2p1 g2p1 g2p1 g2p2 g3p3 g3p1 g2p2 g2p2 g2p2 g2p4 g2p3 g3p3 g2p3 g2p3 g2p3 g1p3 g3p3 g3p4 g2p4 g2p4 g2p4 g1p2 g1p4 g1p2 g2p1 g1p4 g2p1 Gene 3 g3p1 g3p1 g3p1 g3p4 g3p2 g2p4 g3p2 g3p2 g3p2 g3p3 g3p3 g3p3 g3p4 g3p4 g3p4 G G
Pairs used Abs. Call FoldChange Diff Call Probe set Pos Neg Ave Diff Pairs YDL200C 16 2 2378 10.5 20 18 P NC YDL200D 16 3 237 M 4.9 20 19 I 15 A YDM167A 7 7 5003 20 14 MI -11.8 MD -3.7 D Data manipulation is essential prior to submission of results to third party clustering and analytical programs Hierarchical clustering Plaid clustering SOMs
SOMs Self organizing maps or SOMs are a popular method for detecting patterns in large data sets
How do we get the individual gene signals using RMA in EC? Sample 1 Sample 2 Sample 3 Gene 1 Average g1p3 g1p1 g2p1 g1p1 g1p1 g1p4 g2p4 g1p2 g1p2 g2p3 g1p2 g2p3 g1p2 g1p3 g1p3 g3p4 g1p3 g1p1 g3p1 g1p4 g1p4 g2p2 g1p4 g3p2 g3p2 g1p1 g2p2 g1p1 g3p1 g1p3 Gene 2 g2p1 g2p1 g2p1 g2p2 g3p3 g3p1 g2p2 g2p2 g2p2 g2p3 g2p4 g3p3 g2p3 g2p3 g2p3 g3p3 g1p3 g3p4 g2p4 g2p4 g2p4 g1p4 g1p2 g1p2 g2p1 g1p4 g2p1 Gene 3 g3p1 g3p1 g3p4 g3p1 g3p2 g2p4 g3p2 g3p2 g3p2 g3p3 g3p3 g3p3 g3p4 g3p4 g3p4 G G
Sample 1 Sample 2 Sample 3 Gene 1 g1p3 g1p1 g2p1 g1p1 g1p1 g1p4 g2p4 g1p2 g1p2 g2p3 g1p2 g2p3 g1p2 g1p3 g1p3 g3p4 g1p3 g1p1 g3p1 g1p4 g1p4 g2p2 g1p4 g3p2 g3p2 g1p1 g2p2 g1p1 g3p1 g1p3 Gene 2 g2p1 g2p1 g2p1 g2p2 g3p3 g3p1 g2p2 g2p2 g2p2 g2p3 g2p4 g3p3 g2p3 g2p3 g2p3 g3p3 g1p3 g3p4 g2p4 g2p4 g2p4 g1p4 g1p2 g1p2 g2p1 g1p4 g2p1 Gene 3 g3p1 g3p1 g3p4 g3p1 g3p2 g2p4 g3p2 g3p2 g3p2 g3p3 g3p3 g3p3 g3p4 g3p4 g3p4 G G
Sample 1 Sample 2 Sample 3 Gene 1 g1p1 g1p3 g2p1 g1p1 g1p1 g1p4 g1p2 g2p3 g1p2 g1p2 g2p4 g2p3 g1p3 g1p3 g3p4 g1p3 g1p2 g1p1 g1p4 g1p4 g2p2 g1p4 g3p1 g3p2 g3p2 g1p1 g2p2 120 95 216 300 112 150 50 110 150 g1p1 g3p1 g1p3 Gene 2 g2p1 g2p1 g2p1 g2p2 g3p3 g3p1 g2p2 g2p2 g2p2 g2p4 g2p3 g3p3 g2p3 g2p3 g2p3 g1p3 g3p3 g3p4 g2p4 g2p4 g2p4 g1p2 g1p4 g1p2 g2p1 g1p4 g2p1 Gene 3 g3p1 g3p1 g3p1 g3p4 g3p2 g2p4 g3p2 g3p2 g3p2 g3p3 g3p3 g3p3 g3p4 g3p4 g3p4 G G
The information content of the human genome 7% not transcribed } 1% ORF Protein-coding genes 1%UTR Functional Long ncRNAs 35-40% Intron Non-protein-coding RNAs ~10% The Human Genome Small RNAs ENCODE Consortium (Nature 2007 Vol 447: 799-816)
The increase in complexity among eukaryotes is concomitant with an increase in the ratio of non-coding to coding DNA Mattick, 2007
Obstacles that thwart a successful analysis of micro-array data Development of specific, more appropriate statistical tools for use with microarrays Intimacy with nature (strengths and deficiencies) of the raw data Intimacy with nature (strengths and deficiencies) of the raw data Facile use of computer operating system is absent Facile use of computer operating system is absent Biological interpretation Biological interpretation Thorough mining of the data for useful information Biology experiment complete Inadequate Computer skills to handle large datasets Functional annotation of results Inadequate Computer skills to handle large datasets Functional annotation of results Application of available statistical tools Application of available statistical tools