Download
1 / 28
280 likes | 375 Views
How to Understand High Food Prices. Christopher L. Gilbert University of Trento, Italy, and Birkbeck, University of London, UK cgilbert@economia.unitn.it and c.gilbert@bbk.ac.uk. ICABR Conference, 18 June 2009, Ravello, Italy. The story so far ….

E N D
How to Understand High Food Prices Christopher L. Gilbert University of Trento, Italy, and Birkbeck, University of London, UK cgilbert@economia.unitn.it and c.gilbert@bbk.ac.uk ICABR Conference, 18 June 2009, Ravello, Italy
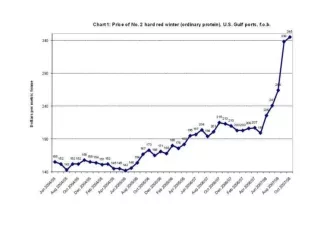
The story so far … Major grain and oil seed prices rose sharply in 2007 through to mid-2008. Palm oil led, followed by wheat; maize (corn) lagged. Sugar remained flat. Prices fell back, although not to their original levels, in the second half of 2008, rice less so than other grains. Prices have staged a recovery in 2009, although not on a dramatic scale.
The wider story Movements in agricultural prices were less dramatic than those in either metals or energy, both of which also rose earlier than ags. Agricultural raw materials (natural rubber excepted) did not participate in the boom IMF commodity price indices
Structure of this talk • What type of factors can explain major movements in agricultural commodity prices? • Time series analysis: What are the lessons from history? • The possible role of futures markets • What explained the 2006-08 price spike? • Was diversion of food crops into biofuels the (or a) main culprit? If not, what was the cause? • [Why are prices rising again?]
Demand and supply • Movements in prices in 2006-08 were common to a large number of agricultural commodities. • Ag economists generally see demand as stable with price rises resulting from supply shocks. Although there were some supply problems in 2006 and 2007, harvests were generally good in 2008. • Stock levels for many major ags had become low, but this was not new in 2007 and 2008. Low stocks can explain why a shock has a large impact (positive or negative) but cannot explain the origin of the shock. • Because standard explanations of price change are unavailable, economists have tended to seize on biofuel demand to explain the 2006-08 price changes.
Biofuels (after Don Mitchell, 2008) • Biofuels demand was responsible for the largest part of the rise in food prices but resists the temptation to quantify this share. Abbot et al (2008) concurred with this view. • Maize is the main feedstock crop in the US, oilseeds hold that position in Europe, Brazil uses sugar cane. Thailand uses cassava while palm oil has been most important elsewhere in south Asia. • The global use of maize for feed rose by 1.5% over the four years 2004-07 while its use as a biofuel feedstock grew by 65% over the same period. 70% of the increase in maize production over this period has gone into biofuels. • The expansion in maize production was largely at the expense of soybeans – the 23% increase in the US area devoted to maize in 2007 was associated with a 16% decline in soybean area. • The eight largest wheat exporting countries expanded the area devoted to rapeseed and sunflower by 36% over the period 2001-07 while wheat area in the same countries fell by 1%.
1973-74 • Many commentators have noted the parallels with between the 1973-74 and 2006-08 commodity price booms. • The1973-74 boom in ag prices in 1973-74 occurred against the backdrop of a general rise in commodity prices. • Both this and the 2006-08 boom took place in the context of enormous world liquidity resulting in part from large US trade deficits and loose monetary policies. • In both cases, oil prices jumped sharply upwards. • Both booms ended sharply with the onset of recession, in the second quarter of 1974 and third quarter of 2008 respectively. • Metals prices rose strongly in both booms. • Coffee and cocoa were sidelined in both cases. • Ags led other commodities in 1973-74 but lagged in 2006-08.
Cooper and Lawrence (1975) • Movements in prices in 2006-08 were common to a large number of agricultural commodities. • Cooper and Lawrence (1975), who discussed the causes of the 1973-74 boom, emphasized that the markets were inter-related at that the boom required a “general explanation” over and above “intriguing and sometimes significant” stories relating to particular markets. • Common price movements need to be explained by common factors. • Is biofuels demand an “intriguing” and perhaps “significant story relating to particular markets” or can it explain the general rise in prices?
Finance 101 – the CAPM • A simple CAPM-like model views the change in the jth food commodity price as Regression of the price change on the shock x gives an R2 of • If we aggregate across n such goods we get • If the shocks j are completely idiosyncratic, they become unimportant in an aggregate index. Regression of the aggregate price change on the common shock x gives an R2 of • Common price movements need to be explained by common factors
2. Time series analysis 1971-2008 Sir Clive Granger (1934 – 2009) 2003 Nobel laureate
Possible common factors • GDP growth? • Monetary expansion? • Exchange rate changes? • The oil price? • Futures market factors? I use Granger (non-)causality analysis to investigate, in a deliberately a-theoretical manner, which of these factors played a significant role over the period 1971-2008 (152 quarterly observations).
1971-1989: GDP growth, monetary expansion and the dollar exchange rate predominate. 1990-2008: The oil price is seen as predominant.
Summary • Cooper and Lawrence (1975) argued for the importance of monetary factors in 1973-74: commodities were seen as a safe real asset in a period of unreliable monetary values. • Futures markets do not emerge as important from the Granger causality analysis but this may be because I lack a good measure of their potential impact over the long period. • Dollar depreciation has a consistent impact over time – but the the less than unit elasticity implies a relatively low impact. • Oil price rises resulted in deflationary measures by governments and central banks in the ’70s and ’80s and so impacted ag prices negatively. The impact has become positive in the current decade. • GDP growth is seen as less important now than historically. It is unclear whether this is indeed the case or whether world rapid growth in middle income countries has rendered GDP measures less accurate than previously.
Price formation • There are active futures markets for many of the most important agricultural commodities – wheat, maize, soybeans, where prices rose sharply over 2006-08, and also cocoa, coffee, cotton and sugar, where there was no boom. • Active trading allows markets to efficiently incorporate information about supply and demand fundamentals. If non-fundamentally based trading takes place, futures markets can act as a distorting lens. • If prices become too high won’t Warren Buffett sell? If there are too few experts relative to the amateurs, and if the experts have short time horizons (for example, because of quarterly reporting), they will tend to follow the amateurs hoping to get out in time (De Long et al, 1991). • Many commentators (Desai, Masters, Phillips, Soros) have suggested that commodity futures prices were a type of bubble over 2006-08.
Index investment in futures markets • This is a relatively new phenomenon. • Investors have identified commodities as an “asset class” . They see portfolio diversification advantages in adding a proportion of commodity futures to equity and bond portfolios – Gorton and Rouwenhorst (2006). • These position differ from traditional speculative positions in several respects: • They are almost invariably long. • They are typically rolled forward and turn over slowly. • They track specific indices (e.g. DJ-GSCI) rather than taking positions on specific markets. • They can be large in relation to the overall market.
Since 2006, the CFTC has published figures on the offsetting futures positions taken by index providers. These can account for up to 40% of all outstanding positions on these markets. Elena Corazzella and I have constructed an index of these positions, IF, which we use in the subsequent analysis.
Variables analyzed • I have 36 monthly observations from 2006/1 to 2008/12. This forces a parsimonious analysis. • I start by using a standard ADL model to exclude variables from the analysis. • Candidate variables are IP Industrialized production of industrialized countries M World money supply (nominal USD) B Chinese trade balanced (nominal USD) X Index of value of US dollar O Oil price (WTI, nominal) IF Net positions of index providers on US ag markets
Narrowing down the list of suspects • After simplifying the lag distributions I obtain • The dollar exchange rate X, the oil price O and the futures index position index IF emerge as statistically significant. I carry these variables forward to the next stage of the analysis.
Cointegration • Is there an equilibrium relationship between these three variables and the IMF’s agricultural food price index in the Engle-Granger sense that the food price index reverts back to the level implied for equilibrium. • I investigate this question in two ways: • I use OLS to estimate the long run equation, as the initial stage of the Engle-Granger two stage procedure. • I use the Johansen procedure to test for the cointegrating rank in a VAR(2) model linking the levels of the four variables. • In both cases, I establish the presence of a single cointegrating relationship. However, the unrestricted Engle-Granger procedure gives an exchange rate elasticity in excess of unity. Imposition of a unit elasticity is acceptable.
The oil price impact is lower than the 17% estimated by Baffes (2007) and the 15%-20% estimated by Mitchell (2008). • The unrestricted exchange rate elasticities are too high from a theoretical standpoint. • All three estimates imply some inflation of food prices from futures market activity. This explanation competes with the exchange rate.
Getting behind the numbers • The preceding analysis identified dollar depreciation, the rising oil price and futures activity as the proximate causes of the 2006-08 price rises. Where does this leave biofuels demand? • There are three possible channels: • The higher the oil price, the more attractive becomes biofuels production. Anticipating this, the market bids up the prices of grains and oil seeds in relation to rises in the price of oil. • Index futures positions may be speculations on future biofuels demand. • Biofuels may be in the residual (unexplained) component of the food price change (but how can we know?) • To the extent that food prices were driven by exchange rate changes, there is no room for a biofuels explanation.
Reasons for scepticism • Index investments are made for reasons of portfolio diversification (on a generous view) or to speculate in commodities in general (less generously). Ags account for a small proportion of the standard indices. Awareness of biofuel demand is unlikely to have been a major driver of these investments. • The estimated elasticities of food prices with respect to the oil price are in line with those projected on the basis of cost pass-through. • Maize is the major US biofuel feedstock. Wheat is not used as a biofuel so is only affected indirectly. One would expect a smaller impact on wheat than on maize. In fact, wheat prices rose more and earlier than maize prices. • I suspect that biofuels demand is indeed an “intriguing” and perhaps “significant story relating to particular markets”. • More concretely, I think it too early for this audience to concede that biofuels demand has pushed up food prices.