Download
1 / 51
791 likes | 2.57k Views
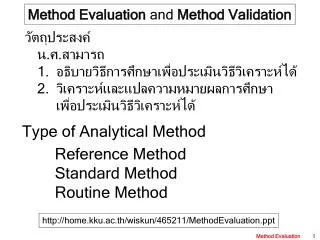
Method Evaluation and Method Validation. วัตถุประสงค์ น.ศ.สามารถ 1. อธิบายวิธีการศึกษาเพื่อประเมินวิธีวิเคราะห์ได้ 2. วิเคราะห์และแปลความหมายผลการศึกษา เพื่อประเมินวิธีวิเคราะห์ได้. Type of Analytical Method. Reference Method Standard Method Routine Method.

E N D
Method Evaluation and Method Validation วัตถุประสงค์ น.ศ.สามารถ 1. อธิบายวิธีการศึกษาเพื่อประเมินวิธีวิเคราะห์ได้ 2. วิเคราะห์และแปลความหมายผลการศึกษา เพื่อประเมินวิธีวิเคราะห์ได้ Type of Analytical Method Reference Method Standard Method Routine Method http://home.kku.ac.th/wiskun/465211/MethodEvaluation.ppt Method Evaluation
Process for Establishing a Routine Test Select, Evaluate Diagnostic Test Select Method of Analysis Validate Method Performance Develop Method Improvements Implement Method Maintain Method Prevent Problems Acquire Specimens Perform Tests Check with Statistical QC Report Results A Routine Laboratory Testing Process From...http://www.westgard.com/lesson20.htm
Method characteristics Application characteristics are factors that determine whether a method can be implemented in a particular laboratory situation. cost-per-test, types of specimens sample volume, turnaround time, workload, equipment and personnel requirements, space, portability, and safety considerations Methodology characteristics are factors which, in principle, should contribute to best performance analytical sensitivity and analytical specificity of the method of analysis choice of chemical reaction, optimization of reaction conditions, principles of standardization and calibration, and the rigor of the analytical procedure Performance characteristics are factors which, in practice, demonstrate how well a method performs. working range, precision, recovery, interference, accuracy, and sometimes detection limit
Ideal Clinical Laboratory Test • Perfect accuracy and precision • High analytical sensitivity • (a limit of detection of zero) • Absolute analytical specificity • (No interferences) • Diagnostic sensitivityand • specificity of 100% Analytical Performance Diagnostic Performance Area under ROC Curve closest to 1.0 (Receiver Operating Characteristic) Likelihood ratios, LR >10 or LR <0.1 Method Evaluation
ความถูกต้อง (Accuracy)คือ ความสามารถเข้าใกล้ค่าจริง (True Value) ของผลการวัด True Value ในที่นี้คือ Conventional True Value (of a Quantity) คือ ค่าซึ่งแสดงคุณลักษณะของปริมาณเฉพาะเจาะจงที่ตกลง ยอมรับร่วมกันจากที่ประชุม โดยมีค่าความไม่แน่นอน(uncertainty)ที่เหมาะสมสำหรับ จุดประสงค์ที่กำหนด คำศัพท์ทางด้านมาตรวิทยา. สถาบันมาตรวิทยาแห่งชาติ [National Institute of Metrology (Thailand)]. [Online] sited on 27 April 2010. Available form URL http://www.nimt.or.th/knowledge/word.html Method Evaluation
ความแม่นยำ (Precision)คือ • องศาของความสอดคล้อง และเป็นไปตามกันของการวัดที่ • ไม่ขึ้นต่อกันของปริมาณอันหนึ่งภายใต้เงื่อนไขเดียวกัน • 2. ค่าความใกล้เคียงกันของผลการวัดซ้ำหลายๆ ครั้ง ซึ่งการ • วัดหลายๆ ครั้ง จะต้องกระทำภายใต้สภาวะและเงื่อนไข • เดียวกัน ความคลาดเคลื่อน (Error)คือ ผลของการวัดลบด้วยค่าจริง ของปริมาณที่ถูกวัด Error = Measured Value - True Value คำศัพท์ทางด้านมาตรวิทยา. สถาบันมาตรวิทยาแห่งชาติ [National Institute of Metrology (Thailand)]. [Online] sited on 27 April 2010. Available form URL http://www.nimt.or.th/knowledge/word.html Method Evaluation
ความไม่แน่นอน (Uncertainty)คือ • ขอบเขตที่กำหนดไว้แน่นอน (Parameter) ร่วมกับ • ผลการวัด ซึ่งบอกลักษณะการกระจายของค่าที่ได้จากวัด • ซ้ำๆ กันที่สามารถทำให้อ้างได้สมเหตุสมผลว่า • เป็นของปริมาณที่ถูกวัด (Measurand) • 2. การรายงานผลการวัด จะต้องรายงานค่าความไม่แน่นอน ปริมาณ = ค่าที่วัดได้+ความไม่แน่นอนที่ระดับความเชื่อมั่น …... % คำศัพท์ทางด้านมาตรวิทยา. สถาบันมาตรวิทยาแห่งชาติ [National Institute of Metrology (Thailand)]. [Online] sited on 27 April 2010. Available form URL http://www.nimt.or.th/knowledge/word.html Method Evaluation
Performance specifications of a new method are • Accuracy (ความถูกต้อง) • Precision (ความแม่นยำ) • Analytical sensitivity (ความไวต่อการวิเคราะห์ปริมาณ) • Analytical specificity to include interfering substances • (ความจำเพาะต่อสารที่วิเคราะห์) • Reportable range of patient test results • (ช่วงที่วิเคราะห์ได้ในตัวอย่างของวิธีตรวจ) • Reference range • (ช่วงค่าอ้างอิง/ปกติ ที่พบในคนปกติ) • Any other performance characteristic required for • test performance Method Evaluation
Analytical MethodEvaluation วิธีวิเคราะห์ /วิธีตรวจวัด การประเมิน • ต้องมี • ข้อมูล/สารสนเทศ • เกณฑ์การตัดสินใจ เป้าหมาย • ผลตรวจเชื่อถือได้ • ถูกต้อง (accuracy) • แม่นยำ (precision) การประเมินวิธีวิเคราะห์ว่าให้ผลตรวจน่าเชื่อถือหรือไม่ Method Evaluation
Observed Distribution And Error concept of Accuracy Observed Mean True Value Westgard JO. The Meaning and Application of Total Error Site on 5Jun09From..http://www.westgard.com/essay111.htm X X X X X X XX X X X X X X X X X X X X X X X X Systemic error, SE Random error, RE Total error, TE Method Evaluation
Systemic error & Random error y = x ผลตรวจ = ค่าจริง No error Constant error y = x + b ผลตรวจ (y) Proportional error y = ax + b ค่าจริง (x) Systemic error (SE) Constant error (CE) Proportional error (PE) Random error (RE) มีรูปแบบ error ที่คาดการณ์ได้ มีรูปแบบ error ที่คาดการณ์ไม่ได้ Method Evaluation
Analytical Method Evaluation Study • Application characteristics study • ศึกษาหลักปฏิกิริยาตรวจและวิธีตรวจ • Linearitystudy • ช่วงการวิเคราะห์ของวิธี => Lower & Upper limit • Precision study • ความแปรปรวนของผลวิเคราะห์ (within run & between run) • Interference study • การรบกวนวิธีวิเคราะห์ของสารที่อาจพบในตัวอย่างตรวจ • Recovery study • ประมาณการ proportional error • Method comparison study • เปรียบเทียบผลตรวจกับวิธีอ้างอิง (Reference method) Method Evaluation
ลำดับการศึกษาเพื่อประเมินความผิดพลาดของวิธีวิเคราะห์ลำดับการศึกษาเพื่อประเมินความผิดพลาดของวิธีวิเคราะห์ Method Evaluation
A = a·b·C Linearity ของการวิเคราะห์ด้วยวิธีวัดการดูดกลืนแสง คำนวณความเข้มข้นจากค่า absorbance ความสัมพันธ์ตามการคำนวณของ สมการ Beer’s law ความสัมพันธ์จริง ช่วงการวิเคราะห์ analytical range Absobance Linearity Higher limit of detection Lower limit of detection 0.00 ความเข้มข้น ต่ำ สูง Method Evaluation
Linearity ของการวิเคราะห์ด้วยวิธีวัดศักย์ไฟฟ้า ช่วงการวิเคราะห์ analytical range Higher limit of detection ศักย์ไฟฟ้า High Cal Lower limit of detection Low Cal ความเข้มข้น Lower limit Higher limit Method Evaluation
Linearity study โดยใช้ตัวอย่างค่าสูงๆ ตัวอย่างค่าสูง เจือจาง ค่าครอบคลุมช่วงตั้งแต่ 0 ถึง 1.5 เท่าของค่าที่ตรวจพบ ในงานประจำวัน Linearity = ค่าสูงสุดของกลุ่มข้อมูลที่ทำให้ slope = 1.00 + 0.03และ intercept = 0.0 + within run precision หรือ %diff ไม่เกิน 10% และ +/- %diff เป็นทิศทางเดียวกัน ค่าวิเคราะห์ได้จากวิธีวิเคราะห์(y) y = a x + b ค่าคำนวณจากการเจือจางตัวอย่าง(x) Method Evaluation
Precision study วิเคราะห์ตัวอย่างเดิมซ้ำ 20 ครั้ง แล้วนำผลการวิเคราะห์มา คำนวณสัมประสิทธิ์ความแปรปรวน (%CV) • ความแม่นยำของการตรวจวิเคราะห์ซ้ำในชุดการวิเคราะห์ • (Within Run Precision) มีผลตรวจมากกว่า 1 ข้อมูล ออกนอกช่วง mean + 2 SD ไม่ควรนำวิธีนี้มาใช้ %CV < ½ ของ Intra-individual variationของสารในร่างกาย เช่น Total protein มี Intra-individual variation = 3% %CV ไม่ควรมากกว่า 1.5% • ความแม่นยำของการตรวจวิเคราะห์ซ้ำระหว่างชุดการวิเคราะห์ • (Between Run Precision) Method Evaluation
Precision study • ความแม่นยำของการตรวจวิเคราะห์ซ้ำระหว่างชุดการวิเคราะห์ • (Between Run Precision) %CV ไม่ควรเกินค่าความผิดพลาดที่ย่อมรับได้(allowable error) ของการตรวจวัดสารนั้น ? Total protein CLIA Acceptable Performance 10% Medical Decision Level 7.0 g/dl CLIA Allowable Error 0.70 g/dl Medically Allowable Error 0.51 g/dl %CV ไม่ควรเกิน = 7.28% CLIA = Clinical Laboratory Improvement Amendments Method Evaluation
http://www.westgard.com/lesson22.htm For short-term imprecision, the within-run standard deviation (sw-run) or the within-day standard deviation (sw-day) should be ¼ or less of the defined allowable total error to be acceptable, i.e., sw-run or sw-day < 0.25 TEa Select at least 2 different control materials that represent low and high medical decision concentrations for the test of interest For long-term imprecision, the total standard deviation (stot) should be 1/3 or less of the defined TE, i.e., stot < 0.33 TEa . Analyze 1 sample of each of the 2 materials on 20 different days to estimate long-term imprecision TE = %Bias + Imprecision (z%CV) Method Evaluation
การประมาณค่า Random error (RE) จาก %CV Random error ที่ค่า meanคำนวณจากสูตร RE = 1.96 x imprecision %CV = 5.0% RE = 1.96 x 5 = 9.8% Medical Decision level = 7.0 RE = 1.96 x 0.35 = 0.69 Total protein CLIA Acceptable Performance10% Medical Decision Level 7.0 g/dl CLIA Allowable Error0.70 g/dl Medically Allowable Error0.51 g/dl Method Evaluation
Interference study ตัวอย่างตรวจทางเคมีคลินิกส่วนมากเป็น serum/plasma สารรบกวนการวิเคราะห์ที่มีโอกาสพบได้แก่ - hemoglobin จากการแตกของเม็ดเลือดแดง - ไขมันที่มีมากในบาง serum - บิลิรูบินที่มีมากในบาง serum - ยาบางชนิดที่อาจมีมากใน serum ตัวอย่างสำหรับศึกษา • ตัวอย่างที่ไม่มีสารรบกวน • ตัวอย่างที่มีสารรบกวน hemoglobin 0 mg/dl bilirubin < 1.5 mg/dl triglyceride < 150 mg/dl ความเข้มข้นที่ระดับค่าอ้างอิง ความเข้มข้นสารรบกวน ตั้งแต่ระดับต่ำไปจนถึงมากสุดที่คาดว่าจะพบได้ ในตัวอย่างของงานประจำวัน Method Evaluation
ตัวอย่างศึกษาผลการรบกวนของ bilirubin ต่อการตรวจวัดกลูโคส Diluents Method Evaluation
ศึกษาการรบกวนของการแตกของเม็ดเลือดแดง (hemolytic serum) ศึกษาการรบกวนของไขมัน (Lipimic serum) Method Evaluation
Recovery study การศึกษาโดยการเติมสารในปริมาณที่ทราบว่ามีความเข้มข้นเท่าใด ลงในตัวอย่างศึกษาแล้วนำมาตรวจวัดและนำมาวิเคราะห์ดูว่า ตรวจวัดได้เป็นร้อยละเท่าใดของปริมาณที่เติมเข้าไปในตัวอย่าง ตัวอย่างศึกษา Recovery ของการตรวจวัดกลูโคส Method Evaluation
Average = 94.75 Proportional error (PE) = | 100 - %Recovery | PE = | 100 – 94.75 | = 5.25% MD Level Med.AE PE 50 5.35 2.6 12012.7 6.3 200 21.4 10.5 Method Evaluation
Average = 94.75 %Expectation [1] วัดได้ 52.7 [2] เติมสาร 47.6จึง expected จะตรวจวัดได้ 100.3 (52.7+47.6) แต่ตรวจวัดได้ 98.3 [3] วัดได้ 121.7 [4] เติมสาร 47.6จึง expected จะตรวจวัดได้ 169.3 (121.7+47.6) แต่ตรวจวัดได้ 166.3 Method Evaluation
Method comparison study ใช้ตัวอย่างศึกษาอย่างน้อย 40 ตัวอย่าง • y-intercept ใช้ประมาณค่า CE • CE = y-intercept • slope ใช้ประมาณค่า PE • PE = (slope-1)x100 • สัมประสิทธิ์สหสัมพันธ์ (r) และ sy/x • ใช้ประเมิน RE ผลตรวจจากวิธีใหม่(y) y = a x + b ผลตรวจจากวิธีอ้างอิง(x) หรือ วิธีที่ใช้ในปัจจุบัน SE = | Yc – Xc | ใช้ประมาณค่า systemic error (SE) Ycคำนวณจากสมการ y = a x + bโดยกำหนดค่า x = Xc Method Evaluation
ผลการศึกษาเปรียบเทียบการตรวจกลูโคสผลการศึกษาเปรียบเทียบการตรวจกลูโคส • วิธีอ้างอิง (x) • วิธีใหม่ (y) y = 0.973x - 5.7, r = 0.9941, n = 82, sy/x = 3.7 MD Level Med.AE PE SE 50 5.35 1.3 7.1 12012.7 3.2 8.9 200 21.4 5.4 11.1 XcYc 5042.9<=0.973x50 - 5.7 120111.1<=0.973x120 - 5.7 200188.9<=0.973x200 - 5.7 ผลต่างใช้บอก SE น.ศ. ลองตอบคำถามนี้ เพื่อทบสอบความเข้าใจ ค่าที่ใช้บอก RE คือ... ค่าที่ใช้บอก CE คือ... ค่าที่ใช้บอก PE คือ... Method Evaluation
Evaluated method Evaluated method Reference method Reference method MD level SEYc 10 0.5 9.5 =1.0612x10-1.1191 15 0.2 14.8 =1.0612x15-1.1191 SEYc 0.1 9.9 =1.005x10-0.1175 0.0 15.0 =1.005x15-0.1175 0.1 4.9 =1.005x5-0.1175 5 0.8 4.2 =1.0612x5-1.1191 Acceptable Performance 5% Allowable error Method Evaluation
Sigma, คือ ค่าเบี่ยงเบนมาตรฐานของข้อมูล กรณีข้อมูลมีการกระจายแบบรูประฆังคล่ำ (ปกติ) ช่วง Mean +SD ใช้ประมาณสัดส่วนจำนวนข้อมูลที่อยู่ใน ขอบเขตนั้น ดังตาราง -6s -5s -4s -3s -2s -1s 1s 2s 3s 4s 5s 6s + 1SD + 2SD + 3SD + 4SD Six Sigma; 6 + 5SD + 6SD Method Evaluation
1.5 SD ความคาดเคลื่อนของกระบวนงาน (ประสบการณ์จากบริษัท โมโตโรล่า; เกิด shift ได้ 1.5SD) Defects Per Million เป้าหมายการผลิตสินค้า ต้องการให้ผลผลิต มีจำนวนเสียหายคิดเป็น Sigma metric = 6 ภายใต้การผลิตที่ shift ไป 1.5s จำนวนสินค้าที่เสียหายต้องไม่เกิน 3.4 DPM -6s -5s -4s -3s -2s -1s 1s 2s 3s 4s 5s 6s Accept region Method Evaluation
ยางรถยนต์จำนวน 6,000,000 เส้นที่ผลิตและนำไปใช้ พบว่า เป็นสาเหตุทำให้เกิดอุบัติเหตุจำนวน 2,000 ครั้ง และมีคนเสียชีวิตจำนวน 100 ครั้ง Defect of production is = = 333 DPM Process performance is 3.5 sigma metric using the DPM without shift column. 5.0 sigma metric using the DPM with 1.5s shiftcolumn. Method Evaluation
Six Sigma provides a new methodology for measuring process performance and refines earlier methodologies for making process improvements. ปัจจุบัน องค์การธุรกิจชั้นนำ ใช้ Sigma metric เป็นตัวชี้ วัดความสำเร็จ และมีเป้าหมายให้ได้ ระดับ 6 Airline baggage handling shows 4.15 Sigma Airline safty shows more than 6 Sigma Method Evaluation
Nevalainen D, Berte L, Kraft C, Leigh E, Morgan T. Evaluating laboratory performance on quality indicators with the six sigma scale. Arch Pathol Lab Med 2000;124:516-519 *Conversion using table with allowance for 1.5s shift From.. http://www.westgard.com/lesson66.htm Method Evaluation
Two Approaches for Measuring Process Performance Measure Outcome Measure Variation Measure Variation of Process Inspect Outcomes and Count Defects Calculate SD and Process Capability Calculate Defect Per Million (DPM) Convert Capability to Sigma Metric Convert DPM to Sigma Metric Method Evaluation
ความผิดพลาดที่ย่อมรับได้ (total allowable error), TEa True Measured value Systemic error Random error Imprecision Bias Total Error (TE) Method Evaluation
Sigma metric concept TE = Bias + Imprecision TE = Bias + z CV True Measured value Allowable total error, TEa TEa = Bias + zCV Imprecision Bias Total Error (TE) ใช้ค่า zประเมินคุณภาพผลการตรวจของห้องวิเคราะห์ และ ติดตามการพัฒนาคุณภาพงานของห้อง ค่า Z คือค่า Sigma ในทางสถิติวิเคราะห์ Method Evaluation
Method Evaluation Decision (MEDx) Chart for Judging Method Performance From… James O. Westgard CLIN LAB SCI vol. 8, no. 5, Sept/Oct 1995, 277-283 Region of Unacceptable Performance TE = Bias + z Imprecision (TE - Bias) Imprecision = ------------- z Poor performance Marginal performance Observed (2.5,3.0) inaccuracy and imprecision Excellent performance Good performance z = 4 z = 3 z = 2 Method Evaluation
Different Concepts of detection limit Lower Limit of Detection LLD Biologic Limit of Detection BLD Functional Sensitivity FS Z sblk Z sspk Z is 2 or 3. Measurement response Zero or “Blank” “Spiked” sample “Spiked” sample LLD = meanblk + Z sblk BLD = LLD + Z sspk FS is estimated as the mean concentration for a spiked sample whose CV is 20%. Westgard, JO. The detection limit experiment. from..http://www.westgard.com/lesson29.htm Method Evaluation
ตัวอย่าง การศึกษา LLD และ BDL ของ PSA measurement Blank sample ( 0 ug/L) : mean = 1000 unit SD = 100 unit Spike sample (10 ug/L) : mean = 2000 unit SD = 200 unit SD of Spike sample (10 ug/L) = 200 unit equal to 2 ug/L FS = 10 ug/L Method Evaluation
เอกสารคำสอน เรื่อง ค่าอ้างอิง (Reference Value) เขียนโดย รศ.ชูชาติ อารีจิตรานุสรณ์ http://home.kku.ac.th/chuare/10/referencevalue.pdf • ประโยชน์ของค่าอ้างอิง • การเก็บข้อมูลเพื่อกำหนดค่าอ้างอิง • - ตัวอย่าง (เป็นตัวแทนของประชากรได้) • คำนวณจำนวนตัวอย่างที่ใช้การศึกษา • http://home.kku.ac.th/wiskun/451710/SampleSizeCal.pdf • - วิธีตรวจ (ต้องเชื่อถือได้) • วิธีกำหนดค่าอ้างอิง • - กรณีข้อมูลกระจายแบบปกติ • mean + 2SD • - กรณีข้อมูลกระจายแบบไม่ปกติ • Percentile 2.5% - 97.5% Method Evaluation
ปฏิบัติการฝึกคำนวณ Reference Value • ให้นักศึกษา download ข้อมูลตัวอย่าง จาก http://home.kku.ac.th/wiskun/465211/DataForRefVal.xls • ซึ่งใน Worksheet ชื่อ Data ของไฟล์ที่ download จะมีข้อมูลผลตรวจสารเคมีชนิดต่างๆ จากผู้ตรวจสุขภาพประจำปี จำนวน 852 คน • กำหนดนิยม "ผู้มีสุขภาพดี" คือ • มี BMI ปกติ (18.5 - 22.9 Kg/m2) • จงวิเคราะห์เพื่อกำหนดค่าอ้างอิงของผลตรวจสารเคมีชนิดต่างๆ • กรณีกำหนดค่าอ้างอิงโดยใช้ช่วง Mean 2 SD • กรณีกำหนดค่าอ้างอิงโดยใช้ค่า Percentile ที่ 2.5% ถึง percentile ที่ 97.5% Method Evaluation
ขั้นตอนการวิเคราะห์ • คัดกรองเอาเฉพาะข้อมูลที่มีค่า BMI ปกติ ก่อน • ใช้ Microsoft Excel function คำนวณค่า • Mean [AVERAGE(…)], • SD [STDEV(…)], • Percentile ที่ 2.5% [PERCENTILE(…,0.025)] และ Percentile ที่ 97.5% [PERCENTILE(…,0.975)] • เพื่อกำหนดค่าอ้างอิงกรณีแยกตามเพศและกรณีไม่แยกตามเพศ • ทำตารางสรุปผลการวิเคราะห์ข้อมูลเพื่อกำหนดค่าอ้างอิงไว้ในอีก Worksheet ส่งไฟล์ผลงานการวิเคราะห์ให้ อ.วิสุทธิ์ กังวานตระกูล ที่ e-mail: wiskun@kku.ac.thหลังการฝึกปฏิบัติเสร็จ Method Evaluation
Diagnostic Performance Diagnostic sensitivityandspecificity Evaluated Method Gold or Standard Method Method Evaluation
Diagnostic sensitivityandspecificity Sensitivity = Specificity = Positive predictive value = Negative predictive value = Prevalence = Efficiency = Method Evaluation
Specificity = Sensitivity = Cut-off level Cut-off level ไม่เป็นโรค ไม่เป็นโรค ความไวสูง และ ความจำเพาะสูง ความไวต่ำ แต่ ความจำเพาะสูง ก ข No False Positive False Negative No False Positive No False Negative เป็นโรค เป็นโรค ความถี่ ความถี่ True Positive True Negative True Negative True Positive ค่าผลตรวจ ค่าผลตรวจ A B C D Cut-off level Cut-off level ความไวสูง แต่ ความจำเพาะต่ำ ไม่เป็นโรค ความไวสูง และ ความจำเพาะสูง ไม่เป็นโรค No False Negative False Positive ค ง เป็นโรค เป็นโรค ความถี่ ความถี่ False Negative False Positive True Positive True Negative True Negative True Positive ค่าผลตรวจ ค่าผลตรวจ A B A B C D C D Method Evaluation
Likelihood Ratio; LR The likelihood ratio of a positive test result (LR+) is sensitivitydivided by 1- specificity. The likelihood ratio of a negative test result (LR-) is 1- sensitivity divided by specificity. In general, a diagnostic test with an LR of >10 or <0.10 changes pretest probability dramatically and is considered a strong diagnostic test. Method Evaluation
การใช้ UPCRและ UA proteinวินิจฉัยภาวะ Proteinurea (>300mg/24-h urine) Method Evaluation