Download
1 / 37
390 likes | 607 Views
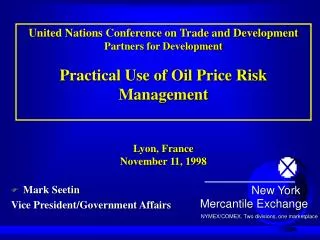
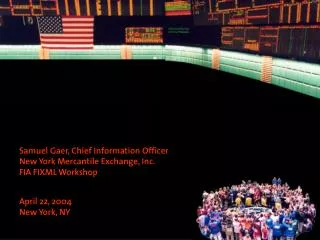
Las Vegas - March 27, 28 & 29, 2011 Adriano Dias Maciel. Oil Futures are traded on the NYMEX (New York Mercantile Exchange) Pit Trading

E N D
Las Vegas - March 27, 28 & 29, 2011 Adriano Dias Maciel
Oil Futures are traded on the NYMEX (New York Mercantile Exchange) Pit Trading Monday through Friday from 9:00 AM to 2:30 PM EST Electronic Trading 6:00 PM through 5:15 PM daily, Sunday through Friday www.TradeStocksAmerica.com
Most important hours Open of Pit Session – 9:00 AM EST London Session Close – 11:30 AM EST (Attention for changes during the year – changes March 27th – European Daylight Savings Time begins.) Economic Data Release (http://www.forexfactory.com/) www.TradeStocksAmerica.com
Important hours Weekly US Crude Oil Inventories by EIA Usually, it is released on Wednesdays at 10:30 AM. If any Bank Holiday occurs during the week, the data will be released on Thursday at 11:00 AM. Attention to API US Crude Oil Inventories, released one day prior to the EIA release, at 4:30 PM. Las Vegas March 27-29, 2011 4 www.TradeStocksAmerica.com www.TradeStocksAmerica.com
Understanding Futures Symbols Future (2 letters)Month of ExpirationYear of expiration (last number) CL K 1 NG F 2 There are 12 Crude Oil contracts in a year, one for each month. Las Vegas March 27-29, 2011 5 www.TradeStocksAmerica.com www.TradeStocksAmerica.com
Which Contract to trade? We are going to trade the front month contract. Near the 20th of each month, we change the contract to the next month, based on higher volume. (Rollover) We begin monitoring which contract has the most volume on the 17th of each month. Las Vegas March 27-29, 2011 6 www.TradeStocksAmerica.com www.TradeStocksAmerica.com
Example: We are in March and trading the May contract (CL K1). We will keep trading this contract until the next rollover (near the 20th) and then we will change to trading the June Contract (CL M1). Las Vegas March 27-29, 2011 7 www.TradeStocksAmerica.com www.TradeStocksAmerica.com
Intraday Range Usually, Crude Oil has a range of 200-300 ticks each day. What is a Tick? Minimum variation of prices in futures (equal to 1 cent). Each Tick represents $10 per contract. If you BUY 1 contract at 102.40 and SELL at 102.41, then you will have a $10 gross profit. Las Vegas March 27-29, 2011 8 www.TradeStocksAmerica.com www.TradeStocksAmerica.com
Advantages to trading futures (Crude Oil) With $5,000 it is possible to open an account. High Leverage (can also be a disadvantage). This market is very liquid, spreads are very tight, normally avoiding bad fills. The focus will be on one or two instruments. Only 1 screen needed. Las Vegas March 27-29, 2011 9 www.TradeStocksAmerica.com www.TradeStocksAmerica.com
Advantages to trading futures (crude oil) No ECN Decisions. Fills are executed by price and time placed only. Most brokers offer charting software for free. Small commissions are charged compared to other investments. A short is available at all times. There are no locate or uptick rules. Las Vegas March 27-29, 2011 10 www.TradeStocksAmerica.com www.TradeStocksAmerica.com
Margins & Commissions The margin for Crude Oil and other futures varies from broker to broker. High Volume Traders can negotiate lower commission prices with their broker. It is possible to find a broker with a $1,000 intraday margin requirement for Crude Oil that charges less than $6.00 Round Trip per contract, all fees included. Las Vegas March 27-29, 2011 11 www.TradeStocksAmerica.com www.TradeStocksAmerica.com
TransAct Users TransAct offers a CME Group waiver fee for their eSignal clients. The user has free access to the feed for NYMEX traded futures (including CL and NG contracts). Users can save $93 each month Las Vegas March 27-29, 2011 12 www.TradeStocksAmerica.com www.TradeStocksAmerica.com
TransActSteven SweetZaner GroupToll Free Direct: 888-434-8142Direct: 312-277-0109E-Mail: ssweet@zaner.com Las Vegas March 27-29, 2011 www.TradeStocksAmerica.com
RealtickJames BohrerLightspeed TradingToll Free Direct: 1 800 228 4216 ext 3629Direct: 312 827 3629E-Mail: jbohrer@lightspeed.com Las Vegas March 27-29, 2011 www.TradeStocksAmerica.com
Underlying forces behind price and areas of Support and Resistance As we analyze charts, we need to remember the underlying forces that create and cause them to work in a predictable fashion. To understand this better, it’s helpful to consider all market participants at any given time. We can divide these participants into three categories: The undecided: Those who are watching and have not yet decided when and on what side they should enter. The longs: Those who have purchased the stock betting on the price to go higher. The shorts: Those who have sold the stock betting on the price to go lower. We consider an area of support and resistance where prices have been fluctuating. The longer amount of time that the prices have stayed in the area, the more significant that support and resistance becomes. To understand this point, let’s consider that the market begins to move higher from a support area and the effect this would have on our three market participants described above. Las Vegas March 27-29, 2011 www.TradeStocksAmerica.com www.TradeStocksAmerica.com
The longs that bought around the support area are naturally excited and most likely regret not buying even more; there is a very good chance that they would buy more the next time the market presents them with the opportunity by going back down to the support area. The shorts that sold at the support area are losing money and are very nervous. They are hoping and waiting for a pull-back to the area where they bought so they can get out of their positions even. The third group that’s sitting on the sidelines watching all of this are kicking themselves for not getting in the action in the support area when they had the opportunity and are hoping for a dip back to that area so they could get in. As you can see, what makes the support area such a powerful tool in chart analysis is that human psychology dictates that all of our three market participants are resolved to buy at the next dip to the support area. Naturally, this tendency of all our market participants to buy if the prices decline to the support area will help to push the price back up again. It should also be clear the more market participants that have a vested interest in a particular support area, the more likely that it will hold and the higher the prices are likely to go on the next rise as there will be more people buying in the dip to the support area. This is exactly the reason that the longer that the prices stay in the support or resistance area, the more meaningful it becomes. The other two factors that add to the significance of support and resistance are volume and when the trading took place. High volume, of course, is important because it shows a high number of shares have been exchanged in that area which indicates more vested interest and as a result the tendency for more buying at any pull-back to the support area. www.TradeStocksAmerica.com www.TradeStocksAmerica.com
The examples that we have considered have discussed the support side. However, the psychology applies to the resistance side just as well but in the reverse. Let’s consider that prices move lower from the area where they have fluctuated for some time. Now, that area becomes a resistance area, even if at some point in time the same area could have served as a support area. All the market participants that may have bought at the support area are now losing money and regretting their decision. They’re praying for the opportunity to sell their shares without losing money. Any price increase back to the support area will give the participants that opportunity to sell and break even. As a result, if the price does go back up to the previous support, this massive selling from the market participants will cause the price to go back down again. Ironically, the previous support has now become resistance, and the more significant that the support had been the more meaningful the resistance is going to be. www.TradeStocksAmerica.com www.TradeStocksAmerica.com
Morning Routine (Stocks) Review major news stories (Briefing Trader). Review expected news releases for each day (Trade the News). Check the major indices overnight action and change, then check stocks that are gapping up or down, based on news or just because they are following these indices…with that, make 4 lists - one for stocks gapping up and down due to news and one for gappers up and down with no news --- in this case, make sure the stock is not moving in sympathy with a competitor. www.TradeStocksAmerica.com www.TradeStocksAmerica.com
Morning Routine (Futures) Check overnight volatility and areas of support and resistance, make notes and set alerts in my charts for these areas. Check volume – consider waiting for the volume to reach at least 30,000 contracts in the Crude Oil (CL), before entering the first trade. Check the economic calendar for announcements that will create volatility. www.TradeStocksAmerica.com www.TradeStocksAmerica.com
Indicators (Stocks and Futures) 8 and 20 SMA, 50 EMA, 200 S & EMA (add 100 SMA to the Daily chart) VWAP Previous day High, Low and Close lines and today’s Opening price line (not to be used in the Daily chart) Pivot lines CCI (28) Multiple Chart time frames (1 min x 2 days / 30 min x 10 days / Daily 1000 days) Stochastics (14, (14), 7) and Volume Trend Hunter *** Trend line identification (I use Regression Lines) *** Distribution Lines (not on the Daily Chart) *** Heat Gauge (measures volatility and market action over the volume, not to be used in the Daily chart) *** ***customized indicators www.TradeStocksAmerica.com www.TradeStocksAmerica.com
Indicators Colors (Stocks and Futures) 8 sma - Red 20 sma- Dark gray 50 EMA - Orange 100 SMA - Blue 200 SMA - Dotted red 200 EMA - Dotted Black VWAP - Blue Open Price (Current session) - Blue High (Previous day) - Green Low (Previous day) - Red Close (Previous day) - Orange Pivot lines - Purple CCI (28) - Blue www.TradeStocksAmerica.com www.TradeStocksAmerica.com
Alerts (sounds) Volume Acceleration Daily events Market Open Closing of London Session Closing of US Session 4 Hits Price Spikes (These alerts are all customized) www.TradeStocksAmerica.com www.TradeStocksAmerica.com
Blue Line – Today`s Open Red Line – Previous Day`s Low Green Line – Previous Day`s High Orange Line – Previous Day`s Close March 27, 28 & 29, 2011 24 www.TradeStocksAmerica.com
March 27, 28 & 29, 2011 25 www.TradeStocksAmerica.com