Download

1 / 28
280 likes | 433 Views
Enhancement of MELD. W. Ray Kim, MD Mayo Clinic College of Medicine Rochester, MN. Plummer Building, Rochester, MN. Agenda. How to make MELD better As an indicator of pretransplant mortality Add more variable(s): MELDNa Optimize model: Refit MELD

E N D
Enhancement of MELD W. Ray Kim, MD Mayo Clinic College of Medicine Rochester, MN Plummer Building, Rochester, MN
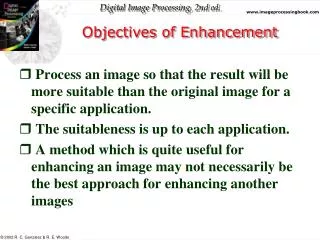
Agenda • How to make MELD better • As an indicator of pretransplant mortality • Add more variable(s): MELDNa • Optimize model: Refit MELD • As an indicator of posttransplant outcome • Limitations
Serum Sodium and Mortality UNOS Registrants, 2005 N=6769 Risk of 3-Month Mortality (after adjusting for MELD) 0.5 1.0 5.0 10.0 115 120 125 130 135 140 145 Na (mEq/L) Kim NEJM 2008;1018
140 135 Na (mEq/L) 130 125 6 10 15 20 25 30 35 40 MELD MELDNa: Incorporating Na to MELD MELDNa = MELD - Na - 0.025*MELD*(140-Na) + 140 Kim NEJM 2008;1018
Based on MELD Based on MELDNa Observed/Expected <20 20-29 30+ <20 20-29 30+ MELD Validation: MELDNa vs MELD Kim NEJM 2008;1018
Refitting Coefficients Methods • Waitlist data obtained from OPTN from 2005-2008: • Model derivation set (05-06): n=14,214 • Model validation set (07-08): n=13,945 • All adult, primary LTx candidates with end stage liver disease included (HCC and status 1 excluded) • The proportional hazards regression analysis predicting mortality within 90 days of listing • Define lower and upper bounds • Optimize coefficients • Bilirubin, Creatinine, INR, and Na
Bilirubin 05-06 data 0.1 1.0 10.0
Bilirubin 05-06 data Current MELD 0.1 1.0 10.0 LB=1.0
Bilirubin 05-06 data Refit 0.1 1.0 10.0 LB=1.0
Creatinine 05-06 data
Creatinine 05-06 data Current MELD LB=1.0 UB=4.0
Creatinine 05-06 data Refit LB=0.8 UB=3.0
INR 05-06 data 0.1 1.0 10.0
INR 05-06 data Current MELD 0.1 1.0 10.0 LB=1.0
INR 05-06 data Refit 0.1 1.0 10.0 LB=1.0 UB=3.0
Sodium 05-06 data
Sodium 05-06 data Refit LB=125 UB=140
Validation: Bilirubin 07-08 data * *Sharma et al. Gastro. 2008;1575
Validation: Creatinine 07-08 data * *Sharma et al. Gastro. 2008;1575
Validation: INR 07-08 data 1.0 10.0 * *Sharma et al. Gastro. 2008;1575
Validation: MELD 07-08 data LB (6) and UB (40) ignored for comparison purpose
Validation: SRTR MELD 07-08 data
Validation: Refit MELD(Na) 07-08 data
‘Kitchen Sink’ ≠ Crystal Ball ‘Unsupervised’ incorporation of all potentially relevant variables C-statistics * includes: refit MELDNa, age, BMI, albumin, HCV, diabetes, prior malignancies ** includes refit MELDNa, age, sex, race, albumin, HCV, HBV, diabetes, prior malignancies,life support, encephalopathy, ascites, previous abdominal surgery, portal vein thrombosis
MELD and Resource Utilization LOS pRBC 29 26 25 18 15 Kim ATC. 2004
C-statistics 0.57 0.88 Transplant Benefit Survival after LTx 90 Days Survival Survival w/o LTx Mean MELD 10.3 14.7 16.8 18.5 20.5 22.5 25.1 28.4 32.7 38.7 Refit MELDNa Deciles
Conclusions • Ways to improve prediction of waitlist mortality • Add more variable: MELD Na • Represents a meaningful improvement • Big change in mortality in a subgroup of patients • Optimize model coeffcients: Refit MELDNa • New upper and lower bounds: • Creatinine: 0.8-3.0 • INR: 1.0-3.0 • Limit to predictability • MELD and post-transplant outcome • Statistically significant impact on survival and resource utilization • Limited accuracy