Download
1 / 28
280 likes | 372 Views
The Trend and Burden of Chronic Diseases and Injury in California. Ron Chapman, MD, MPH Director and State Health Officer California Department of Public Health September 24, 2013. Cost of Disease: California. Health care spending 2009: $230.1 billion Share of GDP: 12.2%

E N D
The Trend and Burden of Chronic Diseases and Injury in California Ron Chapman, MD, MPH Director and State Health Officer California Department of Public Health September 24, 2013
Cost of Disease: California • Health care spending 2009: $230.1 billion • Share of GDP: 12.2% • Government share of spending: Medicare: 22% MediCal: 17% • Per capita spending: All: $6,238,Medicare: $10,954, MediCal: $4,569 • Health spending growth trends 2009: • All: 4.5%, Medicare: 7.4%, MediCal: 9.8% California Health Care Almanac, September 2013, California HealthCare Foundation
Leading causes of death, California, 1996-2010 Source: California Department of Public Health, Vital Records, 2012
Leading Actual Causes of Death in the United States in 1990 and 2000 Based on Mokdad, Marks, Stroup, and Gerberding, 2004
Expenditures on four most costly conditions, U.S, 1997 and 2009 (in billions) Source: Agency for Healthcare Research and Quality. Total Expenses and percent Distribution for Selected Conditions by Source of Payment: U.S., 1997 and 2009. Adapted from California Healthcare Foundation
Prevalence (%) 25.9 - 33.8 33.9 - 38.2 38.3 - 40.7 40.8 - 46.2 Share of adults with one or more chronic conditions, by county, 2007 Age-Adjusted Los Angeles County Service Planning Areas Los Angeles County Lui C, Wallace S. Chronic Conditions of Californians: California Health Interview Survey. Oakland, CA: California HealthCare Foundation, 2010.
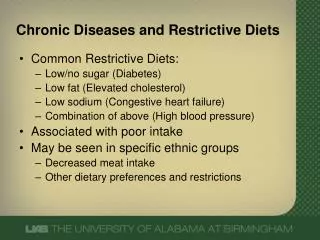
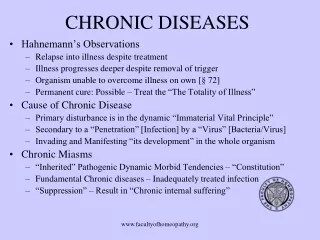
Cost of Chronic Disease: California • Seven common chronic conditions: heart disease, cancers, stroke, hypertension, diabetes, mental disorders and pulmonary conditions shorten lives and reduce quality of life • Economic impact in 2003: $133 billion • Treatment $26.9B (20%) • Lost productivity $106.2B (80%) An Unhealthy America: The Economic Burden of Chronic Disease, Milken Institute, 2007 www.milkeninstitute.org
Value of Prevention • Preventing and managing chronic disease and injury will reduce future economic costs of disease • Improvements in health will increase investments in human and physical capital, driving additional economic growth in the next generation An Unhealthy America: The Economic Burden of Chronic Disease, Milken Institute, 2007 www.milkeninstitute.org
Obesity Risk Factors and Major Causes of Death Heart disease Poor diet Type 2 diabetes Obesity Stroke Lack of physical activity Some cancers
In California, 35.3% of adults are overweight and 25.0% are obese Magnitude Both Blackand HispanicCalifornians have significantly higher rates of obesity than white Californians Black 36.6% Hispanic 31.1% White 23.3% Californians with less than a high school (h.s.) diploma have twice the rate of obesity than those with a college degree Less than H.S. 34.8% College 16.0% Source: Centers for Disease Control and Prevention (CDC). Behavioral Risk Factor Surveillance System Survey Data. Atlanta, Georgia: U.S. Department of Health and Human Services, Centers for Disease Control and Prevention, 2012.
Adult Obesity by Race/Ethnicity Behavior Risk Factor Surveillance System, 1984-2010
Trends Child Obesity Among Participants in the California Child Health and Disability Prevention Program, 1993-2010* *Low-income Children; Obesity = BMI > 95th percentile. Source: California Dept. of Health Services, Children’s Medical Services Branch, California Pediatric Nutrition Surveillance System
FitnessgramChanges in Overweight and Obesity Among California 5th, 7th, & 9th Graders, 2005-2010 Source: Babey SH, Wolstein J, Diamant AL, Bloom A, Goldstein H. A Patchwork of Progress: Changes in Overweight and Obesity Among California 5th, 7th, and 9th Graders, 2005-2010. Los Angeles, CA: UC Los Angeles: UCLA Center for Health Policy Research; 2011.
Obesity-Attributable Expenditures by Payer (in millions*) Medicare Medicaid State-level *2009 dollars Source: Trogdon JG, Finkelstein EA, Feagan CW, Cohen JW. State- and payer-specific estimates of annual medical expenditures attributable to obesity. Obesity. Jan 2012;20(1):214-220.
Diabetes: Size of the Problem • 2.4 million (8.6%) adults have been diagnosed with diabetes: 1 in 12 adult Californians • 1.5 million (5.2%) adults are projected to have undiagnosed diabetes • About11.4 million (41%) of adults are estimated to have prediabetes • Diabetes in pregnancy has increased 60%, from 3.3% in1998 to 5.3% in 2005
Diabetes: Trends in California and US Behavioral Risk Factor Surveillance System, 2000-2009
Cost of Diabetes • Diabetes costs in California exceed $24B each year • Direct medical costs (hospitalizations, medical care, treatment, supplies): $18.7B • Indirect costs (disability payments, time lost from work,premature death): $5.8B • The average annual treatment cost per case for diagnosed diabetes in the US was nearly $10,000 in 2007
Injury and Violence in California • Leading cause of death for people ages 1–44 in California • 16,569 deaths from injuries in 2011 for all ages • 1 person every 32 minutes • Over 250,000 hospitalizations for serious injuries each year • 1 person every 2 minutes • An estimated 2.1 million people treated in Emergency Departments for injuries each year • 4 persons every 1 minute • Injury and violence cost more than $48.6 billion in medical care and lost productivity each year Injury data accessed from EpiCenter http://epicenter.cadph.ca.gov Injury cost estimates adapted from http://www.cdc.gov/injury/wisqars/index.html
Trends: Injury Deaths in California,2002-2011 Injury data accessed from EpiCenter http://epicenter.cadph.ca.gov
Trends: Suicides in California, 2002 -2011 Injury data accessed from EpiCenter http://epicenter.cadph.ca.gov
Trends: Unintentional Poisoning Deaths, California, 2002 -2011 Injury data accessed from EpiCenter http://epicenter.cadph.ca.gov
Trends: Unintentional Deaths Due to Falls, California, 2002-2011 Injury data accessed from EpiCenter http://epicenter.cadph.ca.gov
Trends: Homicides, California, 2002 -2011 Injury data accessed from EpiCenter http://epicenter.cadph.ca.gov
Trends: Unintentional Motor Vehicle-Related Deaths, California, 2002 -2011 Injury data accessed from EpiCenter http://epicenter.cadph.ca.gov