Download
1 / 14
140 likes | 210 Views
A. B. Example: Verification. e.g., input/output specification of multiplier. e.g., multi-level logic representation. 1. 0. 0. 1. Binary Decision Diagrams. Graph-based Representation of Boolean Functions. Introduced by Lee ( 1959 ). Popularized by Bryant ( 1986 ).

E N D
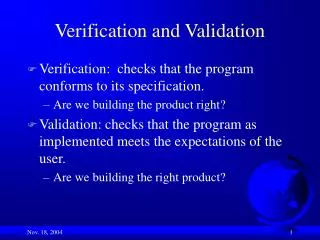
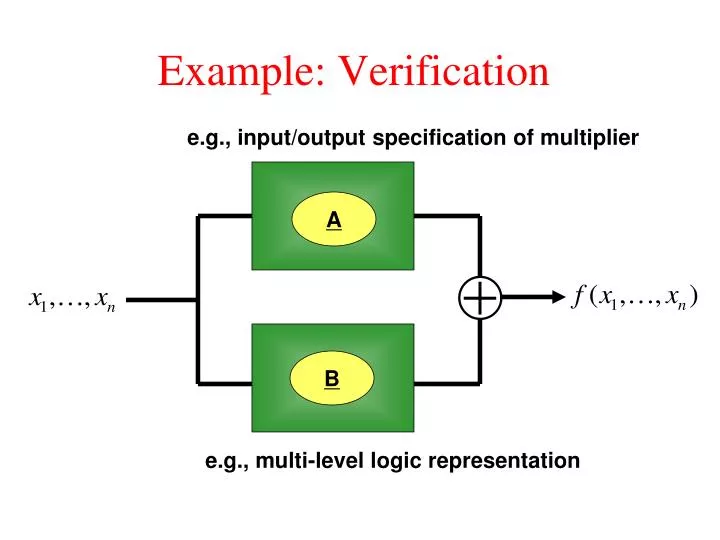
A B Example: Verification e.g., input/output specification of multiplier e.g., multi-level logic representation
1 0 0 1 Binary Decision Diagrams Graph-based Representation of Boolean Functions • Introduced by Lee (1959). • Popularized by Bryant (1986). • compact (functions of 50 variables) • efficient (linear time manipluation) Widely used; has had a significant impact on the CAD industry.
x x x f 1 2 3 0 0 0 0 0 0 1 0 0 1 0 0 0 1 1 0 1 0 0 0 1 0 1 1 1 1 0 1 1 1 1 1 Binary Decision Diagrams Graph-based Representation of Boolean Functions 1 0 BDD is defined asDirectedAcyclicGraph 0 0 1 1
output Digital Circuit Analysis of Digital Circuits Large domain, small range. inputs
output Digital Circuit Analysis of Digital Circuits Large domain, small range. inputs 2mpossibilities 2possibilities
x1 x2 x3 f mvariables 2mrows 0 0 0 0 0 0 1 0 0 1 0 0 0 1 1 1 1 0 0 0 1 0 1 1 1 1 0 0 1 1 1 1 Data Structures Truth Tables Example 2 variables 4 rows 3variables 8 rows 64variables 264rows
S x1 0 1 x2 x2 0 1 0 1 x3 x3 x3 x3 0 1 0 1 0 1 0 1 0 0 0 1 0 1 0 1 Data Structures Decision Diagrams Example x1 x2 x3 f 0 0 0 0 0 0 1 0 0 1 0 0 0 1 1 1 1 0 0 0 1 0 1 1 1 1 0 0 1 1 1 1
S x1 0 1 x2 x2 0 1 0 1 0 1 1 0 1 0 0 1 0 1 1 0 1 0 1 0 0 0 0 1 1 0 1 0 1 Data Structures Decision Diagrams Optimize by merging nodes: x3 x3 x3 x3
x2 0 0 1 0 x3 1 0 0 1 Data Structures Decision Diagrams S Optimize by merging nodes: x1 0 1 x2 1 x3 x3 x3 0 1 0 1 1
S x1 0 1 0 1 1 0 1 1 0 0 x3 x3 x3 x3 0 0 1 1 0 1 1 0 1 Data Structures Decision Diagrams Optimize by merging nodes: x2 x2
1 1 x2 0 1 0 1 Data Structures Decision Diagrams S Optimize by merging nodes: x1 0 x2 1 0 x3 0 1
S T U x1 x1 x1 0 1 0 1 0 1 x2 x2 x2 1 0 1 1 0 0 x3 x3 x3 0 0 0 1 1 1 0 1 0 1 1 0 Data Structures Logic Operations = AND
Decision Diagrams Properties: • Canonical: uniqueup to variable ordering • Compact: represent functions of up to1000 variables • Efficient:performlogic operations inlinear-time