Download
1 / 1

E N D
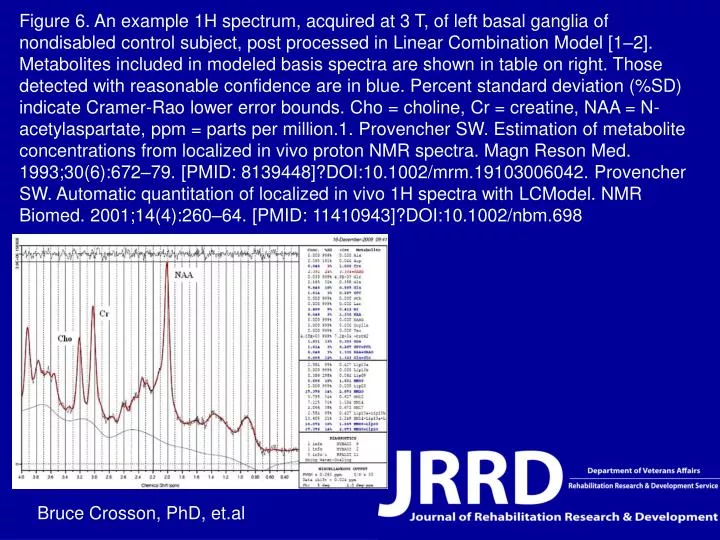
Figure 6. An example 1H spectrum, acquired at 3 T, of left basal ganglia of nondisabled control subject, post processed in Linear Combination Model [1–2]. Metabolites included in modeled basis spectra are shown in table on right. Those detected with reasonable confidence are in blue. Percent standard deviation (%SD) indicate Cramer-Rao lower error bounds. Cho = choline, Cr = creatine, NAA = N-acetylaspartate, ppm = parts per million.1. Provencher SW. Estimation of metabolite concentrations from localized in vivo proton NMR spectra. Magn Reson Med. 1993;30(6):672–79. [PMID: 8139448]?DOI:10.1002/mrm.19103006042. Provencher SW. Automatic quantitation of localized in vivo 1H spectra with LCModel. NMR Biomed. 2001;14(4):260–64. [PMID: 11410943]?DOI:10.1002/nbm.698 Bruce Crosson, PhD, et.al