Download
1 / 1
10 likes | 94 Views
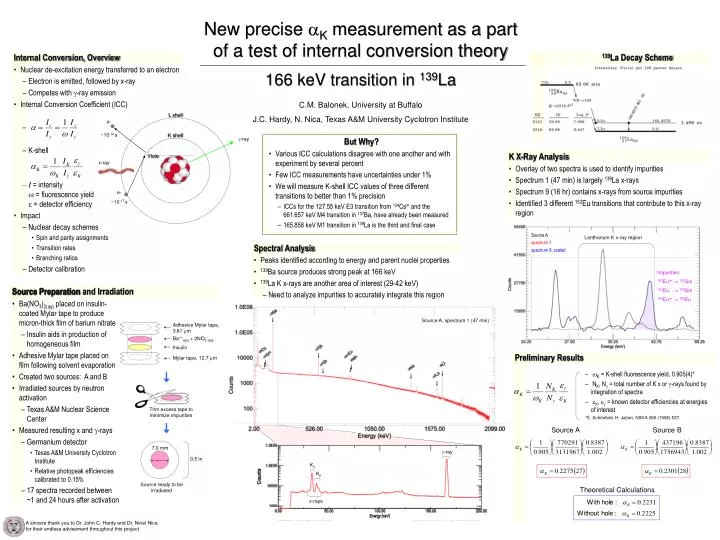
Trim excess tape to minimize impurities. K shell. L shell. e- ~10 -18 s. g -ray. New precise a K measurement as a part of a test of internal conversion theory 166 keV transition in 139 La. Hole. x-ray. e- ~10 -17 s. Source A. Lanthanum K x-ray region. spectrum 1.

E N D
Trim excess tape to minimize impurities K shell L shell e- ~10-18 s g-ray New precise aK measurement as a part of a test of internal conversion theory166 keV transition in 139La Hole x-ray e- ~10-17 s Source A Lanthanum K x-ray region spectrum 1 spectrum 9, scaled Impurities: 152Eum152Sm 152Eu 152Sm 152Eum 152Eu Adhesive Mylar tape, 3.81 mm Ba++(aq) + 2NO3-(aq) Insulin Mylar tape, 12.7 mm g-ray Ka Kb x-rays Source A Source B 7.0 mm 0.5 in Source ready to be irradiated Theoretical Calculations Internal Conversion, Overview • Nuclear de-excitation energy transferred to an electron • Electron is emitted, followed by x-ray • Competes with g-ray emission • Internal Conversion Coefficient (ICC) • K-shell • I = intensityw = fluorescence yielde = detector efficiency • Impact • Nuclear decay schemes • Spin and parity assignments • Transition rates • Branching ratios • Detector calibration 139La Decay Scheme C.M. Balonek, University at Buffalo J.C. Hardy, N. Nica, Texas A&M University Cyclotron Institute But Why? • Various ICC calculations disagree with one another and with experiment by several percent • Few ICC measurements have uncertainties under 1% • We will measure K-shell ICC values of three different transitions to better than 1% precision • ICCs for the 127.55 keV E3 transition from 134Csm and the661.657 keV M4 transition in 137Ba, have already been measured • 165.858 keV M1 transition in 139La is the third and final case K X-Ray Analysis • Overlay of two spectra is used to identify impurities • Spectrum 1 (47 min) is largely 139La x-rays • Spectrum 9 (16 hr) contains x-rays from source impurities • Identified 3 different 152Eu transitions that contribute to this x-ray region Spectral Analysis • Peaks identified according to energy and parent nuclei properties • 139Ba source produces strong peak at 166 keV • 139La K x-rays are another area of interest (29-42 keV) • Need to analyze impurities to accurately integrate this region Source Preparation and Irradiation Source Preparation • Ba(NO3)2(aq) placed on insulin-coated Mylar tape to produce micron-thick film of barium nitrate • Insulin aids in production of homogeneous film • Adhesive Mylar tape placed on film following solvent evaporation • Created two sources: A and B • Irradiated sources by neutron activation • Texas A&M Nuclear Science Center • Measured resulting x and g-rays • Germanium detector • Texas A&M University Cyclotron Institute • Relative photopeak efficiencies calibrated to 0.15% • 17 spectra recorded between ~1 and 24 hours after activation Source A, spectrum 1 (47 min) Preliminary Results • wK = K-shell fluorescence yield, 0.905(4)* • NK, Ng = total number of K x or g-rays found by integration of spectra • eK, eg = known detector efficiencies at energies of interest *E. Schönfeld, H. Jaben, NIM A 369 (1996) 527. A sincere thank you to Dr. John C. Hardy and Dr. Ninel Nica for their endless advisement throughout this project