Download
1 / 32
320 likes | 468 Views
Stable Boundary Layers over Land Bert Holtslag Wageningen University, NL. Presentation mostly based on achievements within GEWEX Atmospheric Boundary Layer Study (GABLS). Towards a better representation of the Atmospheric Boundary Layer in Weather and Climate models.

E N D
Stable Boundary Layers over Land Bert Holtslag Wageningen University, NL Presentation mostly based on achievements within GEWEX Atmospheric Boundary Layer Study (GABLS) Towards a better representation of the Atmospheric Boundary Layer in Weather and Climate models
Why is the stable boundary layer (SBL) important? • Surface temperature forecasting at night • Fog forecasting • Polar climate • Land Climate (night and in winter) • Dispersion studies • Built up of high CO2 (and other scalar) concentrations at night over land...
Example:Mean model bias for the 2 meter temperaturein present winter climate (30 years)Courtesy,Geert Lenderink, KNMI Also impact on diurnal cycle
Mean model difference in 2 meter temperature for January 1996 using two different stabilty functions in ECMWF model (Courtesy A. Beljaars)
Sensitivity to SBL parameterization in Hadley Centre Climate Model, over Antarctic Difference between new (2nd order closure ) and current scheme (1st order closure ) for 1.5m Temperature (K), JJA season, 5 year mean (King et al. 2001, QJRMS)
State of the Art Large Bias and Sensitivity to Stable ABL formulation (at least over Land and Ice!) Operational models typically like enhanced mixing in stable cases What can we learn from fine-scale modeling (LES)? How do operational models compare?
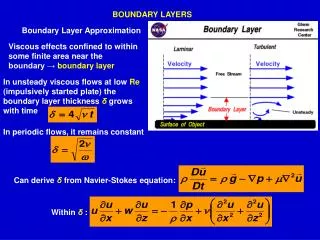
GABLS first inter comparison case Simple shear driven case (after Kosovic and Curry, 2000) Prescribed surface cooling 0.25 K/h (over ice) for 9 hours to quasi- equilibrium; no surface and radiation scheme Geostrophic wind 8 m/s, latitude 73N
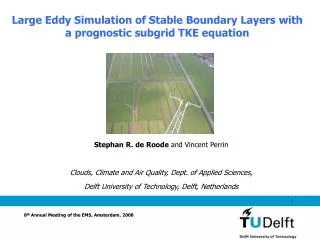
An intercomparison of large-eddy simulations of the stable boundary layer • Domain 400m x 400m x 400m • Resolutions: 12.5m, 6.25m, 3.125m, 2m, 1m • 10 results sets, 17 investigators • Beare et al, 2005 (Accepted for BLM) Coordinated by Bob Beare, Malcolm MacVean, Anne McCabe Met Office, UK See: http://www. gabls.org for details
Mean potential temperature of LES modelsafter nine hours of cooling Significant spread in results, but convergence at highresolution (Sensitivity to sub-grid model) Beare et al, 2005
Mean heat fluxes cf linear heat flux profile derived by Nieuwstadt (1984).
Intercomparison of Single-Column Models Coordinated by Joan Cuxart i Rodamilans, Maria Jiménez, Laura Conangla Universitat de les Illes Balears (Mallorca, SP) Cuxart et al, 2005 (BLM, accepted) http://turbulencia.uib.es/gabls/ Results of more than 20 models (Operational and Research): Various SBL parameterizations and resolutions Next slides focus on operational models in comparison with LES
‘Operational’ Single-Column Models versus LES (Cuxart et al, 2005) GABLS 1D Intercomparison Resolution (most) operational models is set to 6.25 m!
Momentum Fluxes Heat Fluxes
a (u ms-1) ’Ekman spirals’ (Svensson+Holtslag, 2005) LES Operational Research-Meso Research
Boundary-layer height and surface angle LES consistent with Cabauw data!
Models can represent main LES results after adjusting, e.g. length scale: Steeneveld, Van de Wiel, Holtslag, 2005 (BLM, accepted)
Why do models need Enhanced Mixing? To compensate for model errors and to prevent ‘runaway’ surface cooling To have sufficient ‘Ekman pumping’ Future work: Relate mixing to heterogeneity land surface… Study impact of soil characteristics and resolution
Alternative runs with coupling to surface Steeneveld, Van de Wiel, Holtslag, 2005 (BLM, accepted)
GABLS reference Alternative with coupling to surface Steeneveld, Van de Wiel, Holtslag, 2005 (BLM, accepted)
q Impact of resolution in atmosphere and ‘soil’
Summary Large variation among 1D models, but all operational models show too strong mixing!Apparently the turbulence schemes are used to increase operational model performance but this decreases representation of ABL!Details of Atmosphere-land interaction do matter! 8 papers are currently accepted for special GABLS issue in Boundary Layer Meteorology, to appear in 2005/6
What next in GABLS? Intercomparison for a couple of day and night cycles in CASES99 (based on Steeneveld, Van der Wiel, Holtslag, 2005, JAS cond.accept.) Preparation of case by G. Svensson et al for 1D models and T.Lund for LES focussing on PBL (prescribed surface temperature or flux): Case released in May 2005! See www.met.wau.nl/gabls.html
Coupling of new GABLS case study to Land Surface within LOCO (Local Coupled action of GEWEX Land Study) Thanks to all the participating scientists within GABLS (about 50) and many colleagues for providing inputs, model runs, advice, et cetera Results to be discussed at GABLS/LOCO workshopat KNMI, NL, 19-22 september, 2005
Modeling the evolution of three contrasting nights in CASES99 Gert-Jan Steeneveld, Bas van de Wiel, Bert Holtslag
Int. turb Fully turb Non- turb Results with 1D model Duynkerke (1991) Extended with heat diffusion in the soil Steeneveld et al. (2005)
Int. turb Fully turb Non- turb
Int. turb Fully turb Non- turb
Int. turb Fully turb Non- turb
Conclusion • A series of three diurnal cycles for which the nights differ • strongly in their dynamics is available from CASES-99 • Column-Model with high resolution and prescribed • dynamics is performing well in comparison with the • observations!
Momentum stability functions LES is in equilibrium, flat terrain, ‘Sharp tail’ corresponds to observations!