Download
1 / 9
90 likes | 99 Views
Journal of Sports Medicine & Doping Studies has emerged as an important discipline of science which is multidisciplinary in nature. Different subjects such as Exercise and Health, General Sports Physiology, Neuromuscular Physiology, Common Sport Injuries, Joint and Muscular Injury and their respective therapeutics, Related Surgical Issues, Doping Substances and their social aspects, Clinical Sports Medicine, Sports Doping, Sports Biomechanics, Sports Physiotherapy, Sports Orthopaedics, Sports Injury, Rehabilitation, Pain Mechanisms, Sports Podiatry, Physical Activity, Sports Health, Fitness, Sports Nutrition and related content fields are involved to develop this subject as a unique discipline.

E N D
Waghmare and Wang,J Sports Med Doping Stud 2019, 9:3 JournalofSportsMedicine&DopingStudies ISSN: 2161-0673 Journal of Sports Medicine & Doping Studies Research Article Muscle Work in Different Groups of Lower Limb Muscles While Running Antariksh P Waghmare1* and Weijie Wang2 Open Access 1Orthopaedic Surgery, TORT Centre, Ninewells Hospitals and Medical School, University of Dundee, UK 2Institute of Motion Analysis and Research, Tayside Orthopaedic and Rehabilitation Technology, (TORT) Centre, Ninewells Hospital and Medical School, University of Dundee, UK Abstract Background: Running is fundamental skill and requirement of all athletic activities. Therefore, there is a need to understand lower limb muscles function during running. This is also important for refining the existing knowledge regarding increased performance during sport activities. Aim: The aim of the study was to investigate the muscle work of different groups of lower limb muscles during running at different speeds. Method: In total 15 individuals were involved in the study. All of the subjects were made to run in a sports lab providing three good trials of each speed at their convenient slow, comfortable and fast running speeds. Data was gathered using Vicon®, EMG and Inverse dynamics tools and analyzed using SPSS® version 22 programme. Muscle force was calculated with inverse dynamic model using the kinetic and kinematic data of the trials collected from the participants. Result: Hip flexors and knee extensors where found to have a major increase in muscle force when compared with slow to fast speeds while ankle flexors were found to show steady increase in their muscle force with increase in the speed. Similarly hip and knee angle showed a significant change in values while ankle angles did not change much during increasing speeds. Significance: Our study implies the importance of the muscle groups of lower limb while changing pace during running. It is important for professional athletes recovering from an injury. They can concentrate on rehabilitation of individual muscle group required according to the speed their sport involves. Also, they can focus on the development of an individual muscle which is performing more significantly according to the speed their sport requires. Keywords: Running gait; EMG; Limbs muscles Introduction Running is a fundamental skill. It is a critical part of human body movement and fundamental requirement for almost all athletic activities. Therefore, there is a need to understand lower limb muscles function during running. This is also important for refining the existing knowledge regarding increased performance during sport activities. There are different approaches that can be used to study the muscle function of lower limb during running, which includes the measurement of muscle electromyography (EMG) activity, the use of inverse dynamics to determine lower-limb joint moments of force, motion capture system (Vicon®), force plate analysis and joint force analysis. The present study analysed functions of lower limb muscles based on all of the above mentioned methods. Previous study has concluded that primarily faster running is achieved by increasing stride length at a greater rate than stride frequency, but eventually a threshold is reached and a shift in strategy occurs whereby the progression to maximum running speed is achieved by increasing stride frequency at a greater rate than stride length. It has already been proven that during running, the hip flexor and knee extensor produce a large amount of torque which are primarily opposed by the hamstring muscles which in turn makes hamstring more prone to injuries [1]. The hamstring plays an essential role during running. During the terminal swing phase of the stride cycle hamstring muscle will reach ultimate muscle-tendon unit stretch, produces peak force, and performs much negative work (energy absorption). Therefore, it has been suggested that, for running, the hamstrings which includes two joints in its course, are at maximum risk of injury during terminal swing when they are contracting eccentrically [2]. Accordingly, to achieve maximum running speed more work has to be done by the hip extensors and flexors (i.e., the hamstring muscles, iliopsoas, and gluteus maximus) to accelerate the knee and hip joints further vigorously during swing phase, thus maximising stride frequency [3]. Result from studies have shown that, while running, the quadriceps muscles (i.e., vastus medialis, vastus intermedius, vastus lateralis, and rectus femoris), are the major provider to braking the centre of body mass during initial stance phase [4,5]. The Soleus and Gastrocnemius do not play any part in this activity. To date, not enough material has been published regarding the lower limb muscle function at different speeds. Therefore, the purpose of this project was to explore the relationship between different muscle groups and forces acting on them during running at different speeds. The obvious assumption was muscle forces would increase with increasing speed. The research question was which muscle groups would contribute to the increase in the speed. The results from this project will be used to find a positive relationship between use of muscles during increasing speeds while running and their importance in rehabilitation while recovering from injuries. Additionally, such information will help to identify potential factors that might be related to sports related injuries. *Corresponding author: Antariksh P Waghmare, MBBS, MS Orthopaedic Surgery, MCh Orthopaedic Surgery, TORT Centre, Ninewells Hospitals and Medical School, Dundee, DD1 9SY, United Kingdom; E-mail: antariksh373@gmail.com Received November 25, 2019; Accepted December 20, 2019; Published December 31, 2019 Citation: Waghmare AP, Wang W (2019) Muscle Work in Different Groups of Lower Limb Muscles While Running. J Sports Med Doping Stud 9: 221. Copyright: © 2019 Waghmare AP, et al. This is an open-access article distributed under the terms of the Creative Commons Attribution License, which permits unrestricted use, distribution, and reproduction in any medium, provided the original author and source are credited. J Sports Med Doping Stud, an open access journal ISSN: 2161-0673 Volume 9 • Issue 3 • 1000221
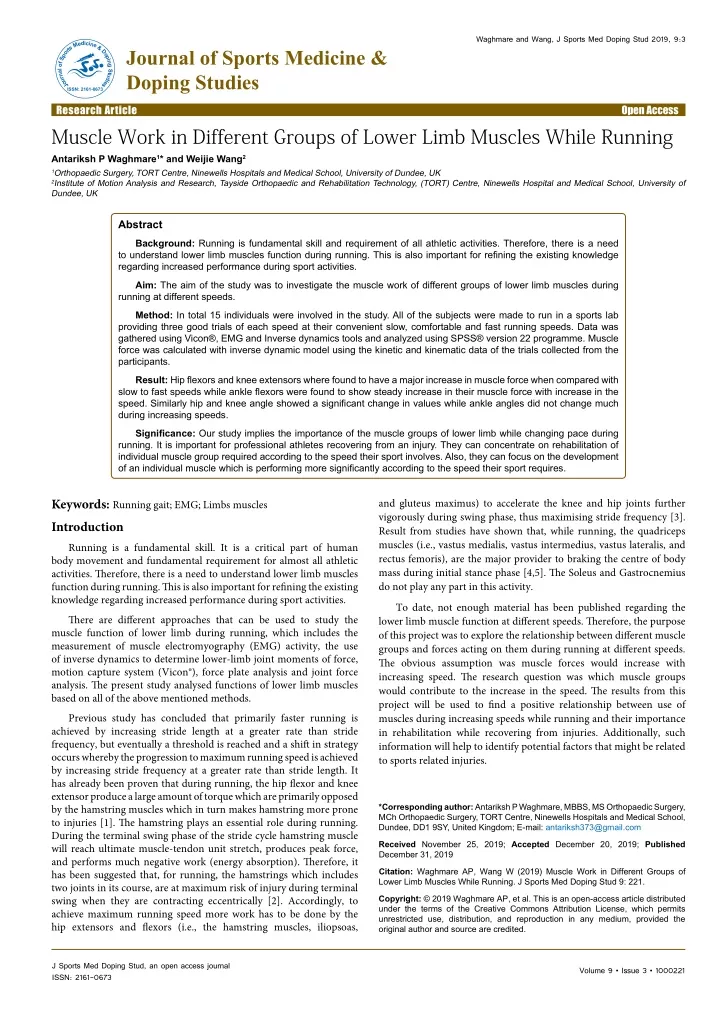
Citation: Waghmare AP, Wang W (2019) Muscle Work in Different Groups of Lower Limb Muscles While Running. J Sports Med Doping Stud 9: 221. Page 2 of 9 Material and Methods Ethical considerations Before participating in the study, all the participants who took part in the study gave written informed consent. Ethical committee approval was obtained from the university. Subjects Fifteen participants were recruited for the project, between age group of 18-40 years and from both male and female gender. 10 males and 5 females (Mean Age of 27, Mean body mass of 76.53 kg and Mean height of 1.71 m with standard deviation 0.09). Participants were selected randomly amongst the volunteers of students, with exclusion criteria being any physical deformities or medical conditions. None of them was professional athletes. The participants were equipped with a pair of shorts and a short sleeved shirt that was taped up as needed to allow the markers around the waist and upper thigh area to be visible by the cameras. They were also provided with appropriate size Nike® footwear prior to measuring and marker placement to standardize the runs. Anthropometric measurements were taken of each of the subjects with the footwear. A total of 16 reflective markers and 4 reflective wands were placed on specific regions of both lower limbs of the subject. The placement of these reflective markers were based on the Vicon® full body plug-in gait model (Figure 1) and some extra markers, e.g. medial knee and ankle ones were added in order to estimate joint centres more accurately. The marker placement and functions were validated in our previous studies, e.g. Nair et al. and Ghaffar et al. [6,7]. The reflective wands were placed after the electrodes of the electromyography (EMG) were put onto the designated sites of lower limb muscle group (Table 1) to maximize contact between the EMG and the skin [8]. The muscle sites used in the study were: rectus femoris, vastus medialis, vastus lateralis, biceps femoris, soleus, tibialis anterior. These represent the major muscle groups of lower limb which play important role while running. Data collection For the analysis of running gait the Vicon® motion capture system along with the nexus version 2.4 software were used. There were 18 Vicon® cameras fixed in a predestined position in the lab along with force plate. Delsys® EMG wireless system used for the study. At the 1 Name Electrode position Rectus femoris Anterior aspect of thigh between Vastus medialis and Vastus lateralis Anteromedial muscle bulge thigh Anterolateral muscle bulge thigh Posterolateral aspect of thigh Muscle bulge posterior of leg Anterolateral leg 2 3 4 5 6 Vastus Medialis Vastus Lateralis Biceps femoris Soleus Tibialis anterior Table 1: Placement of EMG electrode on the lower limb. beginning of data collection for each subject, the first few trials were done to establish an EMG baseline to make sure the EMG were in proper working order. The static T-pose to indicate the presence of all 20 markers and a few trials of runs were performed prior to the actual trial of running. Once the troubleshooting for the EMG and static T-pose trials were sorted out, the format running trials began. Participants were asked to begin the forward running trials at the sports lab of the IMAR, with the first one being a warm up trial at comfortable speed. The subject then ran in the sports lab, at three different speeds (slow, comfortable and fast) according to the participant’s convenience for the length of sports lab, giving minimum of three trials for each speed respectively. These trials for different speeds were randomised using computer randomising method. Forty meters long sports lab equipped with motion recording cameras and force plate were used for the recordings. The processing of the motion capture data were done by the Nexus 2.4 software including labelling, pipelining and detecting the events of the foot while running. The raw data from Vicon® of the trials were imported to provide values for the biomechanical variables defined in the model. The model itself uses inverse dynamics to calculate the muscle forces for multiple lower limb muscles through mathematical optimisation methods described by Wang et al. [9]. Inverse dynamic model In order to estimate muscle force, an inverse-dynamic model were employed. Presumably from physiology, when producing joint moments, the muscles around the joint optimally use the forces to minimise the total muscle power. By mathematical optimisation, the idea can be expressed as follows: ) t (if ( ∑ = n m (1) m ) PCSA i 1 i n or: ∑ (2) ( v ( t ) f ( t ) ) i i = i 1 Subject to Where fi(t) is the muscle force (N) in ith muscle at time t; vi(t) is the muscle velocity in i vector of muscle forces; A is the matrix of the moment-arm of muscles; M is a vector of joint moments; PCSAi is physiological cross-section area in ith muscle; m is a power. The equation (1,2) is the objective function, and the equation (3) is the constrained condition. These two equations construct a problem of mathematical optimisation. (3) ⋅ = A F M th muscle at time t; n is the number of muscles; F is a In our previous study from Wang et al., it was shown that (1), the muscle force obtained was more similar to experimental EMG patterns than using equation (2); thus the equation (1) was adopted for general calculations. So far, there has not been a “golden” objective function which can be widely accepted by the researchers in this field [9]. Figure 1: Placement of reflective marker on a participant. J Sports Med Doping Stud, an open access journal ISSN: 2161-0673 Volume 9 • Issue 3 • 1000221
Citation: Waghmare AP, Wang W (2019) Muscle Work in Different Groups of Lower Limb Muscles While Running. J Sports Med Doping Stud 9: 221. Page 3 of 9 Here we take the lower limb as an example to describe how the equations (1,3) were used to calculate muscle forces. Assuming that the lower limb moves only in the sagittal plane and nine major muscles (groups) were involved in each movement, M in the equation (3) will include three moments of force at the hip, knee and ankle; A will be a matrix of three by nine, including the moment arms of the muscles about the three joints. The matrices of A and M were given by the measurements of muscle attachments and the collection of kinematic and kinetic data. Thus in the equation (1), nine muscle forces, F, would be calculated. Because the number of equations was three and the number of unknown variables (i.e. muscle forces) was nine, this is an undetermined mechanical problem, which cannot be solved by general algebraic methods. The equation (1,3) was solved by using Linear Programming (MATLAB®) [10]. When the model was applied to an individual, her/his body mass and height/leg length was input into the software which will construct a specific musculoskeletal model for this individual and use her/his joint moments in calculation of muscle forces. Thus for each individual, the muscle attachments and muscle PCSAs was specified by using a previous study [9,11,12]. The current model includes nine major muscles, the Rectus Femoris, vasti, hamstrings, i.e. semimembranosus and semitendinosus; gluteus, i.e. gluteus maximus, medius and minimus, soleus, tibialis anterior, iliacus, gastrocnemius, and biceps femoris short head. Statistical analysis All the data that was exported from the muscle and skeleton model was analysed using SPSS® (version 2.4) and MATLAB® (2017) [10]. To analyse data in SPSS software, General linear model, repeated measurers was used. When the variables were not normal distributed, a non-parametric test, e.g. Wilcoxon rank signed test or Friedman test, was used to find the p values. The results obtained from this method will provide the mean value with standard deviation along with p value in all the three speed trials. Results Ten males and five females aged between 18-37 years with varying level of physical activity participated. Detailed anthropometric measurements were taken of individual participant before the beginning of the trails. Gait parameters were calculated from the trials and following values were found as shown in the Table 2. Different muscle groups were found to have values with significant difference during running at slow, comfortable and fast speeds. Hip angle and knee angle showed a significant increase when compared between three speeds while running but ankle angle did not show any significant increase Figure 2. Whereas, significant increase was found in between hip, knee and ankle moment while running at different speeds Figure 3. Significant increase was found in cadence, stride length, stride time and running speed also when compared between slow, comfortable and fast speed Table 2. Muscle force was calculated as shown in Table 3 and Figure 4. Gluteus maximus showed a significant difference between the muscle force at different speeds, it showed an increase of 30% when speed changed from slow to comfortable running while muscle force increased by 40% when the speed shifted from comfortable to fast speed. Rectus femoris showed an increase in muscle force of 15% when compared between slow and comfortable running but it changed to 33% when the pace shifted from comfortable to fast running. Biceps femoris showed a significant difference between runnings at different speeds, it showed an increase of around 28% while shift in speed from slow to comfortable and comfortable to fast pace. Semitendinosus and Semimembranosus also showed a significant difference while running at different speeds with an increase in muscle force of 31% when shifting from slow to comfortable run and 28% increase of muscle force when changing the speed from comfortable to fast Figure 4. Gastrocnemius and soleus showed significant difference when compared between different speeds but the change in speed did not bring much change in there muscle force. Tibialis anterior on the other hand showed a significant difference in muscle force when running at different speed with an increase of 25% when speed shifted from slow to comfortable or comfortable to fast pace of running. EMG was calculated in stance and swing phase Figure 5. Maximum value and Root Mean Square (RMS) of individual muscle in its stance and swing phase were calculated. RMS value was calculated because routine mean value can be nullified, as EMG values are presented on positive and negative side of axis. Table 4 shows the EMG data collected from the trials. EMG data of most of the muscle group showed gradual increase in amplitude with no significant difference in there Root mean square value. Rectus femoris, biceps femoris showed no change in their mean value when speed changed from comfortable to fast. Whereas, rise in their mean value were seen when speed was increased from slow to comfortable pace. Vastus medialis showed almost same mean value Table 2: Gait results derived from all of the running trials. Slow Comfortable 60.8 ± 5.66 Fast Hip Range of movement (Degree) 47.6 ± 2.63 67.1 ± 1.96 p value-Slow vs. Comfortable: 0.048 Comfortable vs. Fast: 0.277 Slow vs. Fast: <0.001 p value-Slow vs. Comfortable: <0.001 Comfortable vs. Fast: 0.001 Slow vs. Fast: <0.001 p value-Slow vs. Comfortable: 0.131 Comfortable vs. Fast: 0.153 Slow vs. Fast: 0.010 p value-Slow vs. Comfortable: <0.001 Comfortable vs. Fast: <0.001 Slow vs. Fast: <0.001 p value-Slow vs. Comfortable: <0.001 Comfortable vs. Fast: <0.001 Slow vs. Fast: <0.001 p value-Slow vs. Comfortable: <0.001 Comfortable vs. Fast: <0.001 Slow vs. Fast: <0.001 p value-Slow vs. Comfortable: <0.001 Comfortable vs. Fast: <0.001 Slow vs. Fast: <0.001 Knee Range of movement (Degree) 66.4 ± 1.75 76.9 ± 2.63 90.1 ± 3.26 Ankle Range of movement (Degree) 46.1 ± 1.72 48.2 ± 1.95 50.1 ± 1.63 Cadence (steps/min) 151.6 ± 2.43 162.7 ± 2.66 189.1 ± 5.02 Stride length (m) 1.7 ± 0.05 2.1 ± 0.05 2.7 ± 0.07 Stride Time (sec) 0.7 ± 0.01 0.7 ± 0.01 0.6 ± 0.01 Running speed (m/sec) 2.1 ± 0.08 2.9 ± 0.08 4.2 ± 0.17 Note: Values are mean ± SE. J Sports Med Doping Stud, an open access journal ISSN: 2161-0673 Volume 9 • Issue 3 • 1000221
Citation: Waghmare AP, Wang W (2019) Muscle Work in Different Groups of Lower Limb Muscles While Running. J Sports Med Doping Stud 9: 221. Page 4 of 9 Figure 2: The joint angles in the sagittal plane for three types of running speeds. Figure 3: The joint moments in the sagittal plane for three types of running speeds. J Sports Med Doping Stud, an open access journal ISSN: 2161-0673 Volume 9 • Issue 3 • 1000221
Citation: Waghmare AP, Wang W (2019) Muscle Work in Different Groups of Lower Limb Muscles While Running. J Sports Med Doping Stud 9: 221. Page 5 of 9 Muscle Force (N/kg) Gluteus Maximus (Max.) Slow Running Comfortable Running Fast Running 412.4 ± 39.72 587.1 ± 37.43 980 ± 119.91 p value-Slow vs. Comfortable: 0.002 Comfortable vs. Fast: 0.001 Slow vs. Fast: <0.001 p value-Slow vs. Comfortable: <0.001 Comfortable vs. Fast: <0.001 Slow vs. Fast: <0.001 (Mean) 57.8 ± 4.73 78.3 ± 5.67 115.5 ± 9.52 Rectus Femoris (Max.) 853.2 ± 160.3 1697.1 ± 696.5 1579.8 ± 438.2 p value-Slow vs. Comfortable: 0.246 Comfortable vs. Fast: 0.871 Slow vs. Fast: 0.082 p value-Slow vs. Comfortable: 0.001 Comfortable vs. Fast: 0.045 Slow vs. Fast: 0.011 (Mean) 65.4 ± 9.47 84.3 ± 11.95 118.5 ± 26.26 Gastrocnemius (Max.) 705.9 ± 77.68 882.8 ± 72.60 1117.7 ± 166.83 p value-Slow vs. Comfortable: 0.031 Comfortable vs. Fast: 0.052 Slow vs. Fast: 0.007 p value-Slow vs. Comfortable: 0.038 Comfortable vs. Fast: 0.229 Slow vs. Fast: 0.013 (Mean) 106.1 ± 7.10 118.1 ± 8.15 129.2 ± 11.82 Vastus Medialis (Max.) 1251.6± 85.65 1438.2 ± 136.95 2546.1 ± 575.37 p value-Slow vs. Comfortable: 0.398 Comfortable vs. Fast: 0.042 Slow vs. Fast: 0.027 p value-Slow vs. Comfortable: 0.038 Comfortable vs. Fast: 0.282 Slow vs. Fast: 0.006 (Mean) 97.1 ± 7.05 135.6 ± 16.99 164.1 ± 24.13 Tibialis Anterior (Max.) 526.1 ± 58.27 695.1 ± 61.60 935.8 ± 154.09 p value-Slow vs. Comfortable: 0.024 Comfortable vs. Fast: 0.042 Slow vs. Fast: 0.011 p value-Slow vs. Comfortable: <0.001 Comfortable vs. Fast: <0.001 Slow vs. Fast: <0.001 (Mean) 45.5 ± 2.97 60.2 ± 4.08 79.7 ± 6.99 Soleus (Max.) 1209.2 ± 121.5 1397.4 ± 141.77 1681.3 ± 134.23 p value-Slow vs. Comfortable: 0.007 Comfortable vs. Fast: 0.017 Slow vs. Fast: <0.001 p value-Slow vs. Comfortable: 0.819 Comfortable vs. Fast: 0.241 Slow vs. Fast: 0.147 (Mean) 159.2 ± 16.05 161.8 ± 18.61 178.2 ± 16.28 Biceps femoris (Max.) 171.1 ± 18.53 236.8 ± 20.24 333.8 ± 54.33 p value-Slow vs. Comfortable: 0.011 Comfortable vs. Fast: 0.029 Slow vs. Fast: 0.006 p value-Slow vs. Comfortable: <0.001 Comfortable vs. Fast: 0.001 Slow vs. Fast: <0.001 (Mean) 21.1 ± 1.58 26.7 ± 1.67 34.3 ± 2.88 Semitendinosus and Semimembranosus (Max.) 442.2 ± 85.15 649.5 ± 90.10 910.6 ± 213.60 p value-Slow vs. Comfortable: 0.035 Comfortable vs. Fast: 0.114 Slow vs. Fast: 0.016 p value-Slow vs. Comfortable: 0.001 Comfortable vs. Fast: 0.038 Slow vs. Fast: 0.002 (Mean) 55.8 ± 7.84 79.7 ± 10.93 107.2 ± 20.74 Note: Values are mean ± SE. Table 3: Muscle Force calculation of all subjects while running at three different speeds. with increase in the speed from slow to comfortable to fast pace. Tibialis anterior also showed similar results without any rise in their mean values with increase in the speed. Vastus lateralis and gastrosoleus showed a continuous rise in their mean value and maximum value when speed increased from slow to comfortable to fast pace. Discussion The present study inspected differences in the amount of muscle activity during running at three different speeds, slow, comfortable and fast. According to the study, rectus femoris and gluteus maximus showed two fold increase of amplitude with speed which proves that increase in speed is achieved by an increased swing phase by improving hip flexor and knee extensor action [8]. Our study showed a similar result. This implies a major change in the muscle force of gluteus maximus and rectus femoris when sifting pace. This shows the importance of strengthening muscles around hip joint before any J Sports Med Doping Stud, an open access journal ISSN: 2161-0673 Volume 9 • Issue 3 • 1000221
Citation: Waghmare AP, Wang W (2019) Muscle Work in Different Groups of Lower Limb Muscles While Running. J Sports Med Doping Stud 9: 221. Page 6 of 9 Figure 4: The muscle forces for three types of running speeds. Figure 5: EMG patterns from some muscles. J Sports Med Doping Stud, an open access journal ISSN: 2161-0673 Volume 9 • Issue 3 • 1000221
Citation: Waghmare AP, Wang W (2019) Muscle Work in Different Groups of Lower Limb Muscles While Running. J Sports Med Doping Stud 9: 221. Page 7 of 9 EMG (Voltage) Rectus femoris Stance Max. Slow Comfortable Fast 0.5 ± 0.08 1.2 ± 0.20 0.8 ± 0.16 p value-Slow vs. Comfortable: <0.001 Comfortable vs. Fast: 0.108 Slow vs. Fast: 0.060 p value-Slow vs. Comfortable: <0.001 Comfortable vs. Fast: 0.719 Slow vs. Fast: 0.003 p value-Slow vs. Comfortable: 0.010 Comfortable vs. Fast: 0.782 Slow vs. Fast: 0.099 p value-Slow vs. Comfortable: 0.005 Comfortable vs. Fast: 0.404 Slow vs. Fast: 0.039 Stance RMS 0.4 ± 0.12 0.6 ± 0.16 0.6 ± 0.15 Swing Max. 0.4 ± 0.10 0.7 ± 0.18 0.7 ± 0.18 Swing RMS 0.1 ± 0.03 0.2 ± 0.06 0.2 ± 0.09 Vastus medialis Stance Max. 2.3 ± 0.48 2.4 ± 0.47 1.8 ± 0.38 p value-Slow vs. Comfortable: 0.705 Comfortable vs. Fast: 0.177 Slow vs. Fast: 0.199 p value-Slow vs. Comfortable: 0.662 Comfortable vs. Fast: 0.746 Slow vs. Fast: 0.835 p value-Slow vs. Comfortable: 0.083 Comfortable vs. Fast: 0.649 Slow vs. Fast: 0.151 p value-Slow vs. Comfortable: 0.170 Comfortable vs. Fast: 0.873 Slow vs. Fast: 0.808 Stance RMS 2.3 ± 0.32 2.4 ± 0.31 2.3 ± 0.3 Swing Max. 2.1 ± 0.46 1.9 ± 0.45 1.8 ± 0.40 Swing RMS 2.1 ± 0.32 2.1 ± 0.32 2.1 ± 0.29 Vastus lateralis Stance Max. 0.5 ± 0.13 0.7 ± 0.11 0.8 ± 0.12 p value-Slow vs. Comfortable: 0.090 Comfortable vs. Fast: 0.358 Slow vs. Fast: 0.008 p value-Slow vs. Comfortable: 0.266 Comfortable vs. Fast: 0.406 Slow vs. Fast: 0.059 p value-Slow vs. Comfortable: 0.044 Comfortable vs. Fast: 0.690 Slow vs. Fast: 0.026 p value-Slow vs. Comfortable: 0.064 Comfortable vs. Fast: 0.193 Slow vs. Fast: 0.033 Stance RMS 1.0 ± 0.23 1.1 ± 0.22 1.3 ± 0.27 Swing Max. 0.3 ± 0.07 0.7 ± 0.22 0.7 ± 0.22 Swing RMS 0.5 ± 0.17 0.6 ± 0.17 0.8 ± 0.25 Soleus Stance Max. 0.6 ± 0.07 0.9 ± 0.14 1.5 ± 0.29 p value-Slow vs. Comfortable: 0.010 Comfortable vs. Fast: 0.022 Slow vs. Fast: 0.002 Slow vs. Fast: 0.002 p value-Slow vs. Comfortable: 0.038 Comfortable vs. Fast: 0.023 Slow vs. Fast: 0.002 p value-Slow vs. Comfortable: 0.044 Comfortable vs. Fast: 0.437 Slow vs. Fast: 0.032 p value-Slow vs. Comfortable: 0.112 Comfortable vs. Fast: 0.025 Slow vs. Fast: 0.007 Stance RMS 0.3 ± 0.1 0.4 ± 0.13 0.8 ± 0.21 Swing Max. 0.1 ± 0.02 0.2 ± 0.06 0.3 ± 0.09 Swing RMS 0.1 ± 0.06 0.2 ± 0.10 0.6 ± 0.2 Tibialis anterior Stance Max. 0.8 ± 0.16 1.1 ± 0.2 1.1 ± 0.1 p value-Slow vs. Comfortable: 0.098 Comfortable vs. Fast: 0.675 Slow vs. Fast: 0.234 p value-Slow vs. Comfortable: 0.005 Comfortable vs. Fast: 0.319 Slow vs. Fast: 0.026 p value-Slow vs. Comfortable: 0.400 Comfortable vs. Fast: 0.286 Slow vs. Fast: 0.067 p value-Slow vs. Comfortable: 0.043 Comfortable vs. Fast: 0.117 Slow vs. Fast: 0.047 Stance RMS 0.1 ± 0.03 0.3 ± 0.07 0.4 ± 0.11 Swing Max. 0.4 ± 0.08 0.5 ± 0.06 0.6 ± 0.08 Swing RMS 0.0 ± 0.01 0.1 ± 0.01 0.1 ± 0.04 Biceps Femoris J Sports Med Doping Stud, an open access journal ISSN: 2161-0673 Volume 9 • Issue 3 • 1000221
Citation: Waghmare AP, Wang W (2019) Muscle Work in Different Groups of Lower Limb Muscles While Running. J Sports Med Doping Stud 9: 221. Page 8 of 9 Stance Max. 0.5 ± 0.08 0.8 ± 0.20 0.9 ± 0.21 p value-Slow vs. Comfortable: 0.047 Comfortable vs. Fast: 0.471 Slow vs. Fast: 0.019 p value-Slow vs. Comfortable: 0.011 Comfortable vs. Fast: 0.080 Slow vs. Fast: 0.006 p value-Slow vs. Comfortable: 0.029 Comfortable vs. Fast: 0.873 Slow vs. Fast: 0.179 p value-Slow vs. Comfortable: 0.185 Comfortable vs. Fast: 0.193 Slow vs. Fast: 0.026 Stance RMS 0.6 ± 0.20 0.8 ± 0.20 1.1 ± 0.24 Swing Max. 0.5 ± 0.01 0.7 ± 0.12 0.7 ± 0.15 Swing RMS 0.5 ± 0.15 0.6 ± 0.17 0.8 ± 0.20 Note: Values are mean ± SE. RMS is root mean square value and Max. is the maximum value. Table 4: EMG results calculated of six muscles of lower limbs. Figure 6: The joint powers for three types of running speeds. extreme increase in the running speed while recovering after an injury. Also a study showed continuous activity of calf muscle as the speed progresses, especially soleus [8]. Our study showed similar results, with an increase of 20% in muscle force of gastrocnemius when shifting speed from slow to comfortable and comfortable to fast, muscle force of soleus increased to 13% from slow to comfortable speed and 17% from comfortable to fast speed. This is also supported by the EMG data of soleus muscle which steadily increase with the change in speed. This suggests that the ankle flexors did not show a major change in their muscle force when shifting speed but they show a steady rise in their values as speed increases. This might imply the constant involvement of ankle flexors with increasing speed, suggesting no major change in their involvement with increasing frequency of the steps or changing the stride length. Tibialis anterior has shown a very high significant difference during changing speed while running [13]. The present study also showed about 25% change in muscle force when changing speed from slow to comfortable or comfortable to fast. EMG data of tibialis anterior also supports this fact by showing significant difference in between both the running speeds. This finding represents the importance of ankle stabiliser with increasing speed. This proves the important role of balancing the body, with acceleration and deceleration done by ankle stabilisers with increasing speed while running. Also, significant change in muscle force of tibialis anterior signifies its role while rehabilitation and building up of this muscle before major rise in speed while running after recovery. According to a study, running across different speeds produced almost same pattern across quadriceps femoris muscle with increase in EMG amplitude which was independent of muscle group [14], but our study showed mean EMG values of rectus femoris and biceps femoris J Sports Med Doping Stud, an open access journal ISSN: 2161-0673 Volume 9 • Issue 3 • 1000221
Citation: Waghmare AP, Wang W (2019) Muscle Work in Different Groups of Lower Limb Muscles While Running. J Sports Med Doping Stud 9: 221. Page 9 of 9 did not increase significantly, whereas the muscle force of rectus femoris and biceps femoris increased significantly with increasing speed. Similar results were seen with vastus medialis and tibialis anterior. This indicates that mean EMG values are not correlated to muscle forces directly. So far there are no accepted models to establish relationship between EMG and muscle force, thus demanding more studies in future related to this field. There was a significant flexion of knee joint during jogging versus running similar to our study which showed knee angle shift of 13% from running at slow speed to comfortable speed and 15% when the speed was changed to fast from comfortable running speed showing significant difference. There was 21% increase in hip angle when compared between slow to comfortable and 10% when compared between comfortable and fast run [13]. Interestingly, there was no significant difference found in ankle angle when shifting the speeds while running. This finding infers that the changes occurring at the hip and knee joint are more while ankle continues to show a steady rise without any major difference with any change in the speed. These finding matches with the muscles force calculated while changing speed around hip and knee joints, which is more compared to muscles around ankle joint. Suggesting it is important to strengthen muscles around hip and knee joints if there is a shift of speed, while ankle muscles are essentially performing at similar strength even for slow speed running with steady increase in their values with increasing speed. This proves the need for development of the strength of ankle flexors before shifting from walking to running. Similar results were found with hip moment, which increased 27% when shifting pace from slow to comfortable and comfortable to fast. Knee moment changed only 10% when speed was changed from slow to comfortable but there was 28% increase when pace shifted from comfortable to fast. Although, ankle moment shifted only 12% when pace changed from slow to comfortable and comfortable to fast. All of the above findings suggest that muscles acting around the hip joint and knee joint play a major role while shifting pace during running. Even hip angle and hip moment changes drastically with a significant change in their value when the changes in speed occur (Figures 2, 3 and 6). There was 21% increase in hip angle when compared between slow to comfortable and 10% when compared between comfortable and fast run. Interestingly, there was no significant difference found in ankle angle when shifting the speeds while running. These finding infers that the changes occurring at the hip and knee joint are more while ankle continues to show a steady rise without any major difference with any change in the speed. Above discussion suggests the importance of development of muscles around hip and knee joint before a major shift in changing pace while running. This shows that while shifting the pace, running at slow and comfortable speeds there is major shift in hip and knee angles while little changes in ankle angle, this may suggest the more changes occurring around hip and knee joint causing those muscles to perform more while shifting pace from slow to fast speed compared to ankle flexors which shows steady increase in their mean value. Conclusion In conclusion, we can emphasise that to our best knowledge, this is the first study that compared muscle force of lower limbs while running at different speeds. More research is required to be done in this field as injuries related to running are major contributor of today’s sports realm. References 1. Schache AG, Dorn TW, Williams GP, Brown NA, Pandy M (2014) Lower-limb muscular strategies for increasing running speed. J Orthop Sports Phys Ther 44: 813-824. 2. Higashihara A, Ono T, Kubota J, Okuwaki T, Fukubayashi T (2010) Functional differences in the activity of the hamstring muscles with increasing running speed. J Sports Sci28: 1085-1092. 3. Schache AG, Dorn TW, Pandy MG (2013) Lower-limb muscle function in human running. Adv in Mech Rob Des Educ Res 14: 323-327. 4. Hamner SR, Seth A, Delp SL (2010) Muscle contributions to propulsion and support during running. J Biomech 43: 2709-2716. 5. Novachek TF (1998) The biomechanics of running. Gait Posture 7: 77-95. 6. Nair SP, Gibbs S, Arnold G, Abboud R, Wang W (2010) A method to calculate the centre of the ankle joint: A comparison with the Vicon Plug-in-Gait model. Clin Biomech (Bristol, Avon) 25: 582-587. 7. Ghaffar M, Raza S, Arnold G, Abboud R, Wang W (2015) A lower limb biomechanical model without using wand-markers for motion analysis during walking and running. Nanotech Precis Eng 5: 383-390. 8. Gazendam MG, Hof L (2007) Averaged EMG profiles in jogging and running at different speeds. Gait Posture25: 604-614. 9. Wang W, Crompton RH, Carey TS, Gunther MM, Li Y, et al. (2004) Comparision of inverse dynamics musculoskeletal model of AL 288-1 australopithecus afarensis and KNM-WT 15000 homo ergaster to modern humans, with implications of the evolution of bipedalism. J Hum Evol 47: 453-478. 10. Matlab® (2017) Available from: https://www.mathworks.com/products/new_ products/release2017a.html 11. Hardt DE (1978) Determining muscle forces in the leg during normal human walking-An application and evolution of optimization methods. J Biomech Eng 100: 74-78. 12. Pedotti A, Krishnan VV, Stark L (1978) Optimization of muscle-force sequencing in human locomotion. Math Biosci 38: 57-76. 13. Tsuji K, Ishida H, Oba K, Ueki T, Fujihashi Y (2015) Activity of lower limb muscles during treadmill running at different velocities. J Phys Ther Sci27: 353-356. 14. Zuniga JM, Malek MH (2013) Electromyographic redponse of the superficial quadriceps femoris muscle during incremental treadmil running. Muscle Nerve 48: 938-944. J Sports Med Doping Stud, an open access journal ISSN: 2161-0673 Volume 9 • Issue 3 • 1000221