Download
1 / 4
40 likes | 107 Views
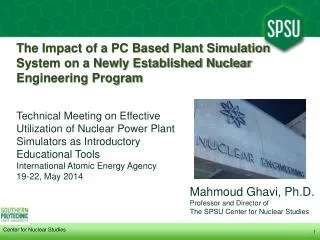
The Case for Nuclear James Conca , Director of the Center for Laboratory Sciences R J Lee Group, Pasco, WA jconca@rjlg.com.

E N D
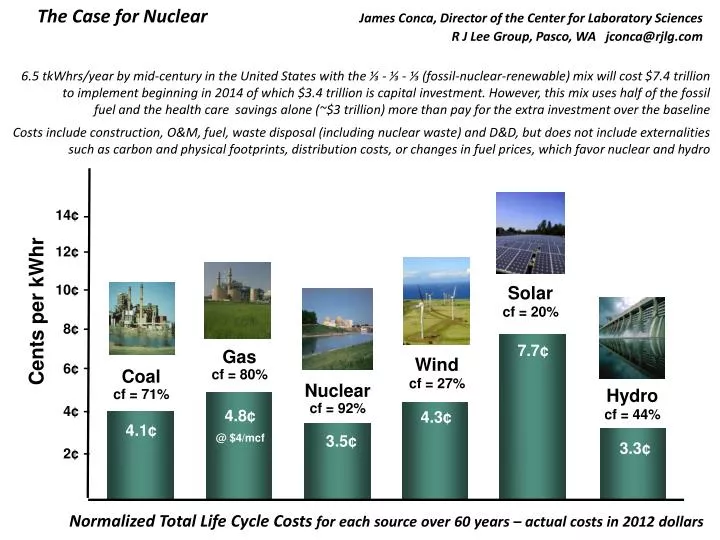
The Case for NuclearJames Conca, Director of the Center for Laboratory Sciences R J Lee Group, Pasco, WA jconca@rjlg.com 6.5 tkWhrs/year by mid-century in the United States with the ⅓ - ⅓ - ⅓ (fossil-nuclear-renewable) mix will cost $7.4 trillion to implement beginning in 2014 of which $3.4 trillion is capital investment. However, this mix uses half of the fossil fuel and the health care savings alone (~$3 trillion) more than pay for the extra investment over the baseline Costs include construction, O&M, fuel, waste disposal (including nuclear waste) and D&D, but does not include externalities such as carbon and physical footprints, distribution costs, or changes in fuel prices, which favor nuclear and hydro 14¢ 12¢ 10¢ Solar cf = 20% Cents per kWhr 8¢ 7.7¢ Gas cf = 80% Wind cf = 27% 6¢ Coal cf = 71% Nuclear cf = 92% Hydro cf = 44% 4¢ 4.8¢ 4.3¢ @ $4/mcf 4.1¢ 3.5¢ 3.3¢ 2¢ Normalized Total Life Cycle Costs for each source over 60 years – actual costsin 2012 dollars
What will it cost to produce this much energy? • (actual costs, not financing costs, subsidies, production credits, mandates) • when comparing, costs must be corrected for capacity factor and lifespan Solar cf = 20% $35.1 b Wind cf = 27% $15 b Hydro cf = 44% Coal cf = 71% Nuclear cf = 92% $ 8 Gas cf = 42% $ 6 $7.5 b $ 4 $7 b $6.2 b $ 2 $3.2 b These costs produce good-paying, but short-term jobs (1 to 6 years) more local jobs for the baseload sources $7 billion 980 MW AP-1000 GenIII nuclear with a cf = 92% and lifespan = 60 yrs 980 MW x 1000 kW/MW x 0.92 x 8,766 hrs/yr x 60 yrs = 469 billion kWhrs to produce 469 billion kWhrs1 unit at $7 billion $1.5 million 1 MW GE turbine with a cf = 27% and lifespan = 20 yrs 1 MW x 1000 kW/MW x 0.27 x 8,766 hrs/yr x 20 yrs = 47 million kWhrs to produce 469 billion kWhrs9,978 units at $15 billion How much does it cost to build a unit/farm/array that will produce 469 billion kWhrs over its lifespan? $820 million 880 MW natural gas CC with a cf = 42% and lifespan = 40 yrs 880 MW x 1000 kW/MW x 0.42 x 8,766 hrs/yr x 40 yrs = 130 billion kWhrs to produce 469 billion kWhrs 4 units at $3.2 billion $300 million 92 MW thin film solar with a cf = 20% and lifespan = 25 yrs 92 MW x 1000 kW/MW x 0.20 x 8,766 hrs/yr x 25 yrs = 4.0 billion kWhrs to produce 469 billion kWhrs117 units at $35.1 billion $3 billion 600 MW hydroelectric with a cf = 44% and lifespan = 80 yrs 600 MW x 1000 kW/MW x 0.44 x 8,766 hrs/yr x 80 yrs = 185 billion kWhrs to produce 469 billion kWhrs2.5 units at $7.5 billion $2.5 billion 750 MW coal plant with a cf = 71% and lifespan = 40 yrs 750 MW x 1000 kW/MW x 0.71 x 8,766 hrs/yr x 40 yrs = 187 billion kWhrs to produce 469 billion kWhrs2.5 units at $6.2 billion < ¼ local 3 years < ¼ local 2 years Key assumptions for different energy systems from recent builds and buys cfLifespanInst. Cap.Inst. Costs Source Coal 0.71 40 years 750 MW $2.5 billion Nevada Energy Natural Gas 0.42 40 years 880 MW $0.82 bilTVA Nuclear 0.92 60 years 960 MW $7.0 billion Westinghouse Wind 0.27 20 years 1 MW $0.0015 bilShell Wind Division Solar 0.20 25 years 92 MW $0.3 billion NRG Energy Hydro 0.44 80 years 600 MW $3.0 billion Susitna Hydro Project 90% local 5-6 years 90% local 5-6 years $40 ¾ local 4-5 years > half local 2-3 years $16 $14 Billions of Dollars $12 $10 Reference spot prices: Oil - $70/b Coal - $40/t NG - $4/mcf Steel - $500/t Copper - $2.50/lb Cement - $70/t 2012($) Construction Costs to produce similar power (469 bkWhrs) function of installation cost, installed capacity (kW), capacity factor(cf), lifespan, 8,766 hours/year
These costs produce almost no local jobs (unless you’re a fuel supplier in that town) Fuel Costs 6¢ 5¢ Gas cf = 42% 4¢ Cents per kWhr 4¢ 3¢ Coal cf = 71% 2¢ 2¢ Nuclear cf = 92% Solar cf = 20% Hydro cf = 44% Wind cf = 27% 1¢ 0.6¢ 0¢ 0¢ 0¢ 2012($) Fuel Costs per kWhrProduced Coal - $40/t NG - $4/mcfU - $100/lb yellowcake
These costs produce good-paying, long-term local jobs (20 to 60 years) longer-term for the baseload sources O&M Costs 1.6¢ Nuclear cf = 92% 1.4¢ Wind cf = 27% 1.2¢ 1.3¢ Hydro cf = 44% 1.0¢ 1.0¢ Cents per kWhr Coal cf = 71% 0.8¢ Gas cf = 42% 0.8¢ 0.6¢ 0.6¢ 0.5¢ 0.4¢ Solar cf = 20% 0.2¢ 0.1¢ 2012($) O&M Costs per kWhrProduced