Download
1 / 62
620 likes | 754 Views
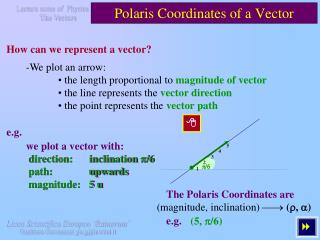
A System for Query, Analysis and Visualization of Multi-dimensional Relational Databases. By Chris Stolte and Pat Hanrahan , Stanford University. Polaris. Presenter: Ganesh Viswanathan CIS6930: Data Science: Large-scale Advanced Data Analysis University of Florida September 15, 2011.

E N D
A System for Query, Analysis and Visualization of Multi-dimensional Relational Databases By Chris Stolte and Pat Hanrahan, Stanford University Polaris Presenter: Ganesh Viswanathan CIS6930: Data Science: Large-scale Advanced Data Analysis University of Florida September15, 2011 Area: Data visualization & Interface design
Motivation • Large multi-dimensional databases have become very common • corporate data warehouses • Amazon, Walmart, … • scientific projects: • Human Genome Project • Sloan Digital Sky Survey • A major challenge for these huge databases is to extract meaning from the data they contain such as: • to discover structure, • to find patterns, and • to derive causal relationship. • Need tools for exploration and analysis of these databases
Existing Tools: Charts • typically provide a “gallery” of charts • hard to iteratively explore • simple charts can display few dimensions
Existing tools: Pivot Tables • common interface to data warehouses • simple interface based on drag-and-drop • generate text tables from databases:
REGION W S N Juice Cola Milk PRODUCT Cream Toothpaste Soap 1 2 3 4 5 6 7 TIME Pivot Tables • Multi-dimensional databases are often treated as n-dimensional data cubes. • Pivot Tables allowrotation of multi-dimensional datasets, allowing different dimensions to assume the rows and columns of the table, with the remaining dimensions being aggregated within the table. Dimensions
Relational databases • Each row in table = basic entity (tuple) • Each column represents a field • Fields can be ordinal, or quantitative
Relational Data Schema • Structural description of data sets • Primitives: attributes, tuples and relations
Motivation • Relational data schema enables flexible database design • No corresponding flexible ways to construct effective UI and visualization • unique data schema • unique visualization/coordination • database keeps changing • different views for same data
Requirements on UI for Analysis and Exploration • Data dense displays: display both many tuples & many dimensions • Multiple display types: different displays suited to different tasks • Exploratory interfaces: rapidly change data transformations and views
Polaris • Polaris is an interface for the exploration of multi-dimensional databases that extends the pivot table interface to directly generate a rich, expressive set of graphical displays.
Polaris Design Goals • Generate rich table-based graphical displays rather than tables of text • Single conceptual model for both graphs and tables • Preserve ability to rapidly construct displays • Interactive analysis and exploration versus static visualization • Simple, consistent interface • Ease analysis and exploration: • Want to extract meaning from data • Process of hypothesis, experiment, and discovery • Path of exploration is unpredictable
Features of Polaris • Builds tables using an algebraic formalism involving the fields of the database. • Each table consists of layers and panes, and each pane may be a different graphic. • An interface for constructing visual specifications of table-based graphical displays. • The state of the interface can be interpreted as a visual specification of the analysis task and automatically compiled into data and graphical transformations.
Features of Polaris • The visual specifications can be rapidly & incrementally developed, giving the users visual feedback as they construct complex queries & visualization. • Ability to generate a precise set of relational queries from the visual specifications. • Users can incrementally construct complex queries, receiving visual feedback as they assemble and alter the specifications.
Visualizing Multidimensional Data Several characteristics to tables make them particularly effective for displaying multi-dimensional data: • Multivariate - multiple dimensions of the data can be explicitly encoded in the structure of the table, enabling the display of high-dimensional data. • Comparative - tables generate small multiple displays of information, which are easily compared, exposing patterns and trends across dimensions of the data. • Familiar - Statisticians are accustomed to using tabular displays of graphs, such as scatterplot matrices and Trellis displays, for analysis. Pivot Tables are a common interface to large data warehouses.
Design Decision: Use a Formalism • Why a formalism? • unification: unify tables and graphs • expressiveness: build visualizations designers did not think of • interface simplicity: clearly defined semantics and operations • code simplicity: composablelanguage versus monolithic objects • declarative: can state what, not how - allows for optimization, etc.
Polaris Formalism • Interface interpreted as visual specification in formal language that defines: • table configuration • type of graphic in each pane • encoding of data as visual properties of marks • Specification compiled into data & graphical transformations to generate display
} table configuration Example specification
Formalism Example: Specifying Table Configurations • Interface: define table configuration by dropping fields on shelves • Formalism: shelf content interpreted as expressions in table algebra • Can express extremely wide range of table configurations
Formalism Example: Specifying Table Configurations • Operands are the database fields • each operand interpreted as a set {…} • quantitative and ordinal fields interpreted differently • Three main operators: • concatenation (+), cross (X), nest (/) • Additionally: dot (.) operator
Quarter 1 Quarter 2 Quarter 3 Quarter 4 31,400 35,600 37,120 30,900 Profit (in thousands) 10 20 30 40 50 60 Table Algebra: Operands • Ordinal fields - interpret domain as a set that partitions table into rows and columns: QUARTER = {Quarter1,Quarter2,Quarter3,Quarter4} • Quantitative fields – treat domain as single element set and encode spatially as axes: PROFIT = {P[0 - 65,000]}
QUARTER + PRODUCT_TYPE = {QTR1,QTR2,QTR3,QTR4} + {Coffee, Tea} = {QTR1,QTR2,QTR3,QTR4, Coffee, Tea} Quarter 1 Quarter 2 Quarter 3 Quarter 4 Coffee Tea 31,400 35,600 37,120 30,900 37,120 30,900 Profit (in thousands) Sales (in thousands) 10 20 30 40 50 60 20 40 60 80 100 120 Table Algebra: Concatenation (+) Operator • Ordered union of set interpretations: PROFIT + SALES = {P[0-65,000], S[0-125,000]}
Quarter 1 Quarter 2 Quarter 3 Quarter 4 Coffee Tea Coffee Tea Coffee Tea Coffee Tea Coffee Tea Profit (in thousands) Profit (in thousands) 10 20 30 40 50 60 10 20 30 40 50 60 Table Algebra: Cross (X) Operator • Cross-product of set interpretations: QUARTER X PRODUCT_TYPE = {(Qtr1,Coffee), (Qtr1, Tea), (Qtr2, Coffee), (Qtr2, Tea), (Qtr3, Coffee), (Qtr3, Tea), (Qtr4, Coffee), (Qtr4,Tea)} PRODUCT_TYPE X PROFIT =
Table Algebra: Nest (/) Operator • QUARTER X MONTH • would create entry twelve entries for each quarter i.e. (Qtr1, December) • QUARTER / MONTH • would only create three entries per quarter • based on tuples in database not semantics • can be expensive to compute
Polaris Display • Drag and drop fields from database scheme ontoshelves • May combine multiple data sources, each data source mapping to a separate layer • Multiple fields may be dragged onto each shelf • Data may be grouped or sorted, and aggregations may be computed
Polaris Display • Selecting a single mark in a graphic displays the values for the mark • Can lasso a set of marks to brush records • Marks in the graphics use retinal properties
Retinal Properties • Ordinal/nominal mapping vs. quantitative mapping • Properties: Shape, size, orientation, and color. • When encoding a quantitative variables, should only vary one aspect at a time
Visual Specification • Is the configuration of the fields of the tables on shelves • User does this by dragging and dropping fields onto shelves • Controls: • Mapping of data sources to layers • # of rows, columns, and layers, and relative order • Selection of tuples from the database • Grouping of data within a pane • Type of graphic displayed in each pane • Mapping of data fields with retinal properties
Graphics • Ordinal-Ordinal: e.g. the table • the axis variables are typically independent of each other • Ordinal-Quantitative: e.g. bar chart • the quantitative variable is often dependent on the ordinal variable • Quantitative-Quantitative: e.g. maps • view distribution of data as a function of one or both variables; discover causal relationships
Types of Graphics (Ordinal- Ordinal) • Axis variables are independent of each other R represents the fields encoded in the retinal properties of the marks Following slide shows sales and margin as a function of product type, month and state for items sold by coffee chain
Ordinal-Quantitative Graphics • Bar charts, dot plots, Gantt chart • Quantitative variable is dependent of ordinal variable Following slide shows a case where a matrix of bar charts is used to study several functions of the independent variables product and month
Quantitative-Quantitative Graphics • Discover causal relationships between the two quantitative variables. Following slide shows how flight scheduling varies with the region of the country the flight originated
Visual mappings • Encoding different fields of the data to retinal properties • Shape, Size, Orientation, Color • Used in the ordinal to ordinal example
Display Types Gantt charts of events for a parallel graphics application on a 32-processor SGI machine. Flights between major airports in the USA Source code colored by cache misses for a parallel graphics application. Major wars and the births of well known scientists as a timeline.
Querying • Three steps: • Select the records • Partition the records into panes • Transform the records within the panes • To create database queries, it is necessary to generate an SQL query per table pane (i.e. must iterate over entire table, executing SQL for each pane).
Generating Database Queries • 1. Selecting the Records
Generating Database Queries • 2. Partitioning the records into pains • Putting retrieved records in their corresponding pane
Generating Database Queries • 3. Transforming Records within the Panes • If aggregation, it is done here
Example application • Cut expenses for a national coffee store • Create table of scatterplots showing relationship between marketing costs and profit (Figure 6a) • Notice trend; certain products have high marketing costs with no or little profit