Download

1 / 5
50 likes | 177 Views
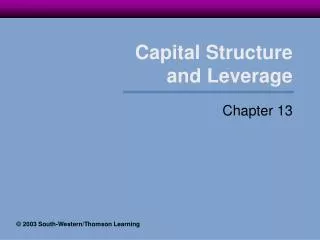
Debt or Equity?. By Professor Jonathan Welch. Characteristics of Debt and Equity. Common Equity. Debt. Maturity Date Claim On Earnings Claim On Assets Voice In Management Investor Risk Company Risk Company Cost. Yes Prior Fixed Legal Prior Impose Restrictions Low High

E N D
Debt or Equity? By Professor Jonathan Welch
Characteristics of Debt and Equity Common Equity Debt Maturity Date Claim On Earnings Claim On Assets Voice In Management Investor Risk Company Risk Company Cost Yes Prior Fixed Legal Prior Impose Restrictions Low High Low No Residual Residual Elect Directors High Low High
Financial Structure - Theory WACC Debt Ratio MV of Debt & Equity Debt Ratio
Financial Structure Check List - Practical • Business Risk • Comparative Ratio Analysis • Ability to Service Debt – Cash Budget • Credit and Bond Rating (www.moodys.com) • EPS, P/E, Pc Impacts • Flexibility, and Future Financing • Timing • Ownership and Control • Personal Wealth Effect • Trial and Error
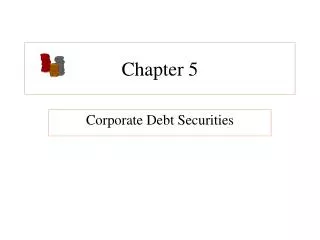
Average Ratios for Various Ratings of Industrial Co’s AAA/Aaa AA/Aa A/a BBB/Baa Pre-tax Interest Coverage Debt to Capital Total Debt to Equity Working Capital to L.T.D. Cash Flow to LT Debt Current ratio Pre-tax Margin ROE Pre-tax ROC Cash Flow to Cap. Expenditures 13.7 18.2% 94% 160% 199% 1.4 10.7% 17.1% 29.2% 1 8% 8.8 30.0% 114% 87% 91% 1.5 11.1% 18% 29.7% 111% 4.1 36.4% 124% 88% 49% 1.7 6.4% 14% 18.1% 111% 2.9 40.3% 129% 95% 34% 1.9 5.8% 11% 15.6% 98% Source: Merrill Lynch, “Fixed Income Research”