Download
1 / 55
550 likes | 636 Views
Cool Data Day(s) 6 minutes to do the following: 1. Discuss Issue 2. Hypothesis 3. Method 4. Design 5. Predictions 6. Rationales 7. Results 8. Conclusions. Cool Data Day(s) 6 minutes to do the following: 1. Discuss Issue 2. Hypothesis 3. Method 4. Design 5. Predictions

E N D
Cool Data Day(s) 6 minutes to do the following: 1. Discuss Issue 2. Hypothesis 3. Method 4. Design 5. Predictions 6. Rationales 7. Results 8. Conclusions
Cool Data Day(s) 6 minutes to do the following: 1. Discuss Issue 2. Hypothesis 3. Method 4. Design 5. Predictions 6. Rationales 7. Results 8. Conclusions Graph Requirements A. Must be an experiment or quasi-exp. B. Must have at least 1 IV (or participant variable) - on X axis C. Must have at least 1 DV - on Y axis D. Cannot be an exp. that we have discussed in class - can be about false memory though if it has not been discussed in class
Grade Criteria (each worth 1 point) • Was ppt presentation sent on time (10:00 AM day of presentation to Jocelyn)? send to jschock@unomaha.edu • Was data from experiment or quasi-experiment? • Was graph in the correct format (e.g., bar, line)? • Were axes labeled and readable? • Were issues, method, design, and results stated clearly and understandable? • Were hypotheses, predictions, rationales, and conclusions stated clearly and understandable? • Was presentation about 6 minutes (i.e., was it too long or too short)?
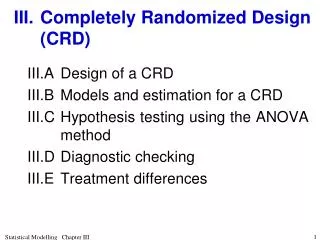
2008 Issue – Do brain images influence perceptions of scientific research? Hypothesis – People naturally like to reduce cognitive phenomena to brain processes, and brain images accompanying data allow them to do that more easily than other visual aids.
Method - In Experiment 1, they presented a scenario that was either accompanied by an fMRI brain image or a bar graph, and subjects were asked to rate if the scientific reasoning in the article made sense. Note, however, that the scientific reasoning did not make sense. For example, one scenario stated that both TV watching and engaging in mental arithmetic activated similar areas in the temporal cortex. Therefore, watching TV makes people better at math.
Design – The independent variable was image type (control, brain image, bar graph), and the dependent variable was a rating on a 1-4 scale to the statement: The scientific reasoning in the article made sense where 1 indicated “strongly disagree” and 4 indicated “strongly agree”
Prediction – implied that ratings would be higher for articles accompanied by brain images Rationale – implied from hypothesis that people naturally like to reduce cognitive phenomena to brain processes
Results Conclusion – brain images are influential due to people’s desire to reduce cognition to brain activity
Why bar graph? IV is categorical Use line graph when IV is not categorical - continuous - discrete, but interval or ratio Results Conclusion – brain images are influential due to people’s desire to reduce cognition to brain activity
Examples of categorical, continuous, and discrete variables categorical – sex (male, female) bar graph continuous – time (beginning, end) line graph discrete - number of presentations (1, 2, 3) line graph
Conclusion - Brain scans can detect criminals - no scientific reasoning errors
Kawamoto, Kello, Jones, & Bame, (1998) 1. Issue – What is the criterion that people use to begin pronunciation in the speeded reading aloud task?
Reading Aloud word clock starts running
Reading Aloud word “word” clock stops RT recorded
Kawamoto, Kello, Jones, & Bame, (1998) 1. Issue – What is the criterion that people use to begin pronunciation in the speeded reading aloud task? 2. Hypotheses – Whole word vs. initial phoneme
Kawamoto, Kello, Jones, & Bame, (1998) 1. Issue – What is the criterion that people use to begin pronunciation in the speeded reading aloud task? 2. Hypotheses – Whole word vs. initial phoneme 3. Method – Reading aloud task
Kawamoto, Kello, Jones, & Bame, (1998) 1. Issue – What is the criterion that people use to begin pronunciation in the speeded reading aloud task? 2. Hypotheses – Whole word vs. initial phoneme 3. Method – Reading aloud task 4. Design – 2 IVs - regularity
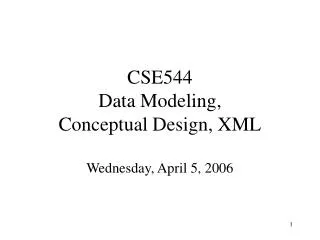
Kawamoto, Kello, Jones, & Bame, (1998) 1. Issue – What is the criterion that people use to begin pronunciation in the speeded reading aloud task? 2. Hypotheses – Whole word vs. initial phoneme 3. Method – Reading aloud task 4. Design – 2 IVs - regularity (regular, irregular) RegularIrregular sane soot punt pint
Kawamoto, Kello, Jones, & Bame, (1998) 1. Issue – What is the criterion that people use to begin pronunciation in the speeded reading aloud task? 2. Hypotheses – Whole word vs. initial phoneme 3. Method – Reading aloud task 4. Design – 2 IVs - regularity (regular, irregular) - IP plosivity (nonplosive, plosive) - DV = RT RegularIrregular Nonplosive IP sane soot Plosive IP punt pint
Reading Aloud soot “sssssoot” clock stops RT recorded
Reading Aloud pint “___pint” clock stops RT recorded
Kawamoto, Kello, Jones, & Bame, (1998) 1. Issue – What is the criterion that people use to begin pronunciation in the speeded reading aloud task? 2. Hypotheses – Whole word vs. initial phoneme 3. Method – Reading aloud task 4. Design – 2 IVs - regularity (regular, irregular) - IP plosivity (nonplosive, plosive) - DV = RT 5. Predictions and Rationales WW – no interaction IP – interaction, regularity effect will be reduced for NPs RegularIrregular Nonplosive IP sane soot Plosive IP punt pint
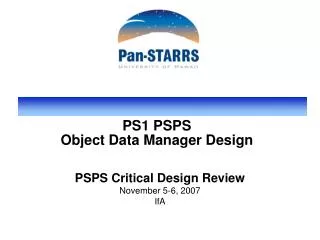
Kawamoto, Kello, Jones, & Bame, 1998 pint punt soot sane
8. Conclusion – WW criterion rejected IP criterion used at least some of the time
Type in levels of IVs and values
Highlight area for graph - put cursor in A1 - hold down shift key - press down arrow twice - press right arrow twice
Click the subtype that you want
A graph will appear in spreadsheet
To move chart to it’s own page, click on Move Chart Location
This will appear in the middle of the screen. Select New Sheet and OK
Something like this will appear - need to change colors - need to insert axis labels - need to increase font size
Select Primary Horizontal Axis Title And then Title Below Axis
Create Primary Vertical Axis Title - use Rotated Title Option
Move this by clicking and dragging
To change font size Click on Home