Download
1 / 32
320 likes | 325 Views
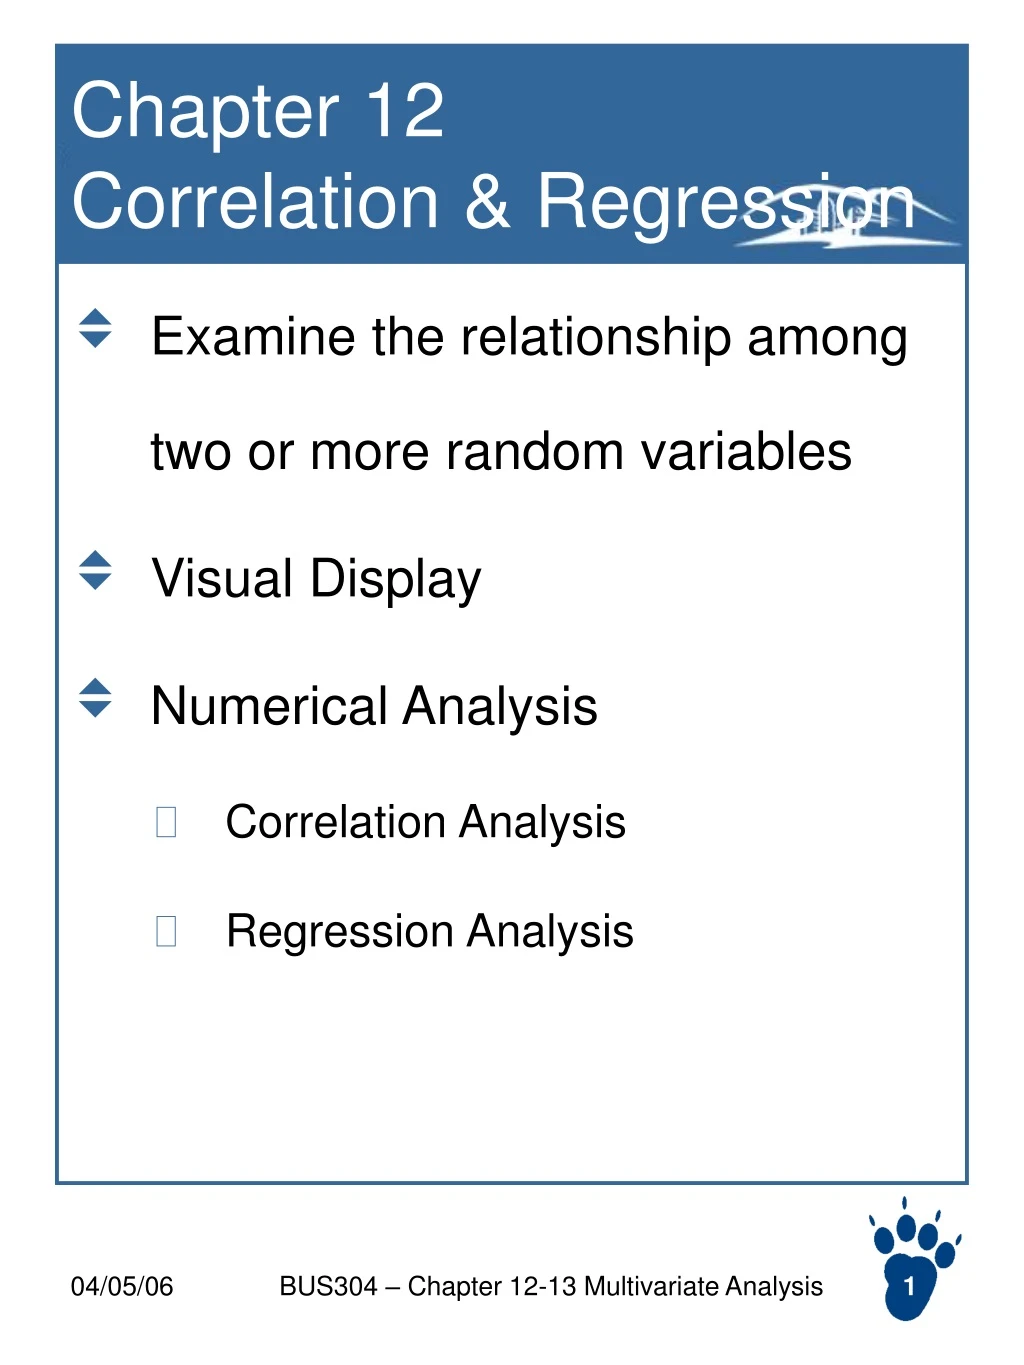
Chapter 12 Correlation & Regression. Examine the relationship among two or more random variables Visual Display Numerical Analysis Correlation Analysis Regression Analysis. Visual Display. How to display the relationship between two variables?

E N D
Chapter 12 Correlation & Regression • Examine the relationship among two or more random variables • Visual Display • Numerical Analysis • Correlation Analysis • Regression Analysis BUS304 – Chapter 12-13 Multivariate Analysis
Visual Display • How to display the relationship between two variables? • E.g. the relationship between a car’s mileage and a car’s value • Scatter Plot! Exercise: create a scatter plot from the data file BUS304 – Chapter 12-13 Multivariate Analysis
Typical Scatter Plots Positive Relation Negative Relation No Correlation Non-linear Relation BUS304 – Chapter 12-13 Multivariate Analysis
Numerical Measure for the relation • Numerical measures: • to formally capture the relationship • to be able to conduct higher level analysis • Commonly Used Measurements: • Covariance • Could be any real number: positive, negative, or 0 • Captures the co-movement of the two variables • The sign indicates the direction of the trend line. • Correlation • A standardized measurement derived from the covariance • The value will be from -1 to 1, • Measures the degree of linearity BUS304 – Chapter 12-13 Multivariate Analysis
Correlation Coefficient • Formula: Use excel to compute the correlation: use excel function: =correl() use data analysis tool correlation BUS304 – Chapter 12-13 Multivariate Analysis
Correlation estimation and typical Scatter Plots BUS304 – Chapter 12-13 Multivariate Analysis
Values of correlation • If the scatter plot is exactly a line • upwards, correlation is +1 • downwards, correlation is -1 • Correlation between the exactly same random variables are +1 • If the value of x has no impact on y, then correlation is 0. • Example: payoff of the first round flip coin game and payoff of the second round flip coin game. BUS304 – Chapter 12-13 Multivariate Analysis
Test the population correlation • Population correlation coefficient: • Sample correlation coefficient: r • Determine whether • ≥ 0, • ≤ 0, or • = 0 based on the sample coefficient r. • Theorem • The t-value for r is • This t-value follows a student’s t-distribution with a degree of freedom n-2 • When r > 0, the t value is positive • When r < 0, the t value is negative • When r = 0, the t value is 0 BUS304 – Chapter 12-13 Multivariate Analysis
Hypothesis test • Take the example of problem 12.6 (p478) • Write down the hypotheses pair: • H0 : ≥ 0 • HA: < 0 • Write down the decision rule: • If t < t, reject the hypothesis H0, • If t ≥ t, do not reject the hypothesis H0. • Make decision: • compute r, then the t value of r • find out t using the t table. • compare t and t to make the decision. Reject when the t value of sample r is too low BUS304 – Chapter 12-13 Multivariate Analysis
Exercise • Problem 12.7 BUS304 – Chapter 12-13 Multivariate Analysis
Practice on correlation model • Type 1: start with a conjecture • e.g. there is a negative correlation between the amount of money a person spend on grocery shopping and the amount of money on dinning out. • Justification: because a person tend to do less grocery shopping when he/she eats in the restaurant more. • Collect data and conduct the test to verify the conjecture. • Type 2: start without a clear conjecture • Based on the available data, find out for any pair of things, whether there is a strong correlation • If there is one, => “warning” • Observe and study why. • You may find out surprising answer: Data Mining BUS304 – Chapter 12-13 Multivariate Analysis
Comments on correlation analysis • It can only identify the comovement. • It cannot indicate the causality • Sometimes, there is a third variable (factor) to explain the comovement. Correlation analysis cannot help you find out the underlying factor • Sometimes, there are multiple factors affecting the comovement. The interaction among factors makes the comovement unpredictable. • We need higher level analysis to get a better understanding. BUS304 – Chapter 12-13 Multivariate Analysis
Simple Regression Analysis • Also called “Bivariate Regression” • It analyzes the relationship between two variables • It is regarded as a higher lever of analysis than correlation analysis • It specifies one dependent variable (the response) and one independent variable (the predictor, the cause). • It assumes a linear relationship between the dependent and independent variable. • The output of the analysis is a linear regression model, which is generally used to predict the dependent variable. BUS304 – Chapter 12-13 Multivariate Analysis
The regression Model • The model assumes a linear relationship • Two variables: • x – independent variable (the reason) • y – dependent variable (the result) • For example, • x can represent the number of customers dinning in a restaurant • y can represent the amount of tips collected by the waiter • Parameters: • 0: the intercept – represents the expected value of y when x=0. • 1: the slope (also called the coefficient of x) – represents the expected increment of y when x increases by 1 • : the error term – the uncontrolled part yi = 0 + 1 * xi+ i BUS304 – Chapter 12-13 Multivariate Analysis
Graphical explanation of the parameters • Assume this is a scatter plot of the population 1 BUS304 – Chapter 12-13 Multivariate Analysis
Building the model • The regression model is used to • predict the value of y • explain the impact of x on y • Scenarios, • x is easily observable, but y is not; or • x is easily controllable, but y is not; or • x will affect y, but y cannot affect x. • The causality should be carefully justified before building up the model • When assigning x and y, make sure which is the reason and which is the result. – otherwise, the model is wrong! • Example: Information System research: • “Ease of use” vs. “The Usefulness” • There may always be a second thought on the causality. BUS304 – Chapter 12-13 Multivariate Analysis
Example • Build up the regression models • At State University, a study was done to establish whether a relationship existed between a student’s GPA when graduating and SAT score when entering the university. • The Skeleton Manufacturing Company recently did a study of its customers. A random sample of 50 customer accounts was pulled from the computer records. Two variables were observed: • The total dollar volume of business this year • Miles away the customer is from corporate headquarters BUS304 – Chapter 12-13 Multivariate Analysis
Estimate the coefficient • Regression Model • Given 0=2 and 1=3, • If knowing x=4, we can expect y. How to know 0=2 and 1=3? • To know 0 and 1, we need to have the population data for all x and y. • Normally, we only have a sample. • The trend line determined by a sample is an estimation of the population trend line. The Fitted Model yi = 0 + 1 * xi+ i b0 and b1 are estimations of 0 and 1, they are sample statistics The hat indicates a predicted value BUS304 – Chapter 12-13 Multivariate Analysis
Estimate the coefficients • Based on the sample collected • Run “simple regression analysis” to find the “best fitted line”. • The intercept of the line: b0 • The slope of the line: b1 • They are estimates of 0 and 1 • We can use b0 and b1 to predict y when we know x The prediction model BUS304 – Chapter 12-13 Multivariate Analysis
How to determine the trend line? • The trend line is also called the “best fitted line” • How to define the “best fitted line”? • There could be a lot of criteria. • The most commonly used one: • The “Ordinary Least Squares” Regression (OLS) • To find the line with the least aggregate squared residual • Residual: for each sample data point i, the y value (yi) is not likely to be exactly the predicted value ( ), the residue: BUS304 – Chapter 12-13 Multivariate Analysis
Solution for OLS regression • The objective function: • Find the best b0 and b1, which minimize the sum of squared residuals • Solution: • Use Excel: • Add a trend line • Run a regression analysis (Data Analysis too kit) BUS304 – Chapter 12-13 Multivariate Analysis
Exercise • Open “Midwest.xls” • Create a scatter plot • Add a trend line. • Provide your estimation of y when • x = 10 • x = 0 • x = 4 • Residue: ei, for each sample data point. • In regression analysis, we assume that the residues are normally distributed, with mean 0 • The smaller the variance of residue, the stronger the linear relationship. BUS304 – Chapter 12-13 Multivariate Analysis
y= 175.8 + 49.91*x Add a trend line • Step 1: Use your scatter plot, right click one data point, choose the option to “add trend line” • Step 2: choose “option tag”, check “Display equation on chart” “OK” BUS304 – Chapter 12-13 Multivariate Analysis
The “Fitness” • Sometimes, it is just not a good idea to use a line to represent the relationship: Just see how well the sample data form a line -- how well the model predicts Not good ! kinda good better BUS304 – Chapter 12-13 Multivariate Analysis
The measurement for the fitness • The Sum of Squared Errors (SSE) • The smaller the SSE, the better the fit. • In the extreme case, if every point lies on the line, there is no residual at all, SSE=0 (Every prediction is accurate) • SSE also increase when the sample size gets larger (more terms to sum up) -- however, this doesn’t indicate a worse fitness. • Other associated terms: • SST – total sum of squares: • Total variation of y • SSR – sum of squares Regression • Total variation of y explained by the model • It can be computed that SST, SSR, and SSE has the following relationship: BUS304 – Chapter 12-13 Multivariate Analysis
R2 • A standardized measure of fitness: • Interpretation: • The proportion of the total variation in the dependent variable (y) that is explained by the regression model • In other words, the proportion that is not explained by the residuals. • The larger the R2, the better the fitness • In the Simple Linear Regression Model, R2=r2. • Compute the correlation and verify. BUS304 – Chapter 12-13 Multivariate Analysis
Read the regression report • Step 1: check the fitness • whether the model is correct • Step 2: what are the coefficients, whether the slope of x is too small? • Interval Estimation of 0 and 1: (conf level: 95%) • 0: 53.3~298.2529 • 1: 26.5~73.31 Better greater than 0.3, The greater the better. p-value of 0 =0 y= 175.8 + 49.91*x p-value of 1 =0 BUS304 – Chapter 12-13 Multivariate Analysis
Confidence Interval Estimation Input the required confidence level BUS304 – Chapter 12-13 Multivariate Analysis
Hypothesis Test • People are normally interested in whether 1 is 0 or not. • In other words, whether x has an impact on y. • Based on the report from excel, it is very convenient to conduct such a test. • Simply compare whether the p value of the coefficient is smaller than or not. • Hypothesis: H0: 1 =0 HA: 1 0 • Decision rules: • If p < , reject the null hypothesis, • If p , do not reject the null hypothesis. • Compare p and , make the decision. BUS304 – Chapter 12-13 Multivariate Analysis
When you don’t have a good fit • If the fitness is not good, that is, the correlation between x and y is not strong enough. • It is always a good idea to check the scatter plot first. • Cases • Case A. Maybe there are outliers (explain the outlier) BUS304 – Chapter 12-13 Multivariate Analysis
Y Y X X Not a good fit? • Case 2: • Check the variation of x. • In order to have a good prediction model, the independent variable should cover a certain range. • Collect more data while guarantee the variations of x. • Case 3: • Inherently non-linear relationship • Non-linear regression (not required) • Segment regression • Separate your data into groups and run regression separately. BUS304 – Chapter 12-13 Multivariate Analysis
Exercise • Problem 12.14 (Page 498) • Problem 12.15 • Problem 12.19 BUS304 – Chapter 12-13 Multivariate Analysis