Download
1 / 35
350 likes | 489 Views
Discover how cluster analysis is used in business intelligence to form groups of similar records, segment markets, and more. Learn about hierarchical and non-hierarchical clustering methods, measuring distance between records and clusters, normalization, and interpreting clusters. Find out how clustering can be applied in various industries such as public utilities and finance.

E N D
Chapter 15 – Cluster Analysis DM for Business Intelligence
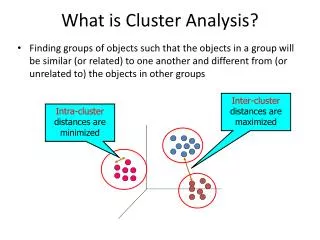
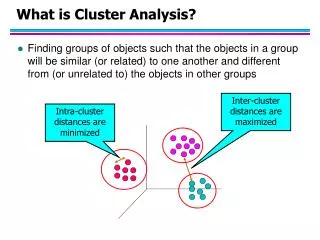
Clustering: The Main Idea Goal: Form groups (clusters) of similar records Used for segmenting markets into groups of similar customers Is Unsupervised Learning Example: Claritas segmented US neighborhoods based on demographics & income: “Bohemian Mix,” “Furs & station wagons,” “Money & Brains,” . . .
Other Applications • Periodic table of the elements • Classification of species • Grouping securities in portfolios • Grouping firms for structural analysis of economy • Army uniform sizes (based on clusters of similar size measurements)
Example: Public Utilities Goal: find clusters of similar utilities Data: 22 firms, 8 variables Fixed-charge covering ratio Rate of return on capital Cost per kilowatt capacity Annual load factor Growth in peak demand Sales % nuclear Fuel costs per kwh
Sales & Fuel Cost: 3 rough clusters can be seen High fuel cost, low sales Low fuel cost, high sales Low fuel cost, low sales
Extension to More Than 2 Dimensions In prior example, clustering was done by eye Multiple dimensions require formal algorithm with • A distance measure • A way to use the distance measure in forming clusters We will consider two algorithms: • hierarchical • non-hierarchical
Hierarchical Methods Agglomerative Methods • Begin with n-clusters (each record its own cluster) • Keep joining records into clusters until one cluster is left (the entire data set) • Most popular Divisive Methods • Start with one all-inclusive cluster • Repeatedly divide into smaller clusters
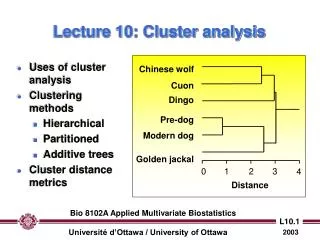
A Dendrogram shows the cluster hierarchy At distance = 4, 4 clusters are formed At distance = 3, 9 clusters are formed At distance = 1.75, 20 clusters are formed At distance = .5, each point is a cluster
Measuring Distance 2 ways to measure distance . . . • Between 2 records • Between 2 clusters
Distance Between Two Records Euclidean Distance is most popular:
Normalizing Problem: Raw distance measures are highly influenced by scale of measurements (e.g., Sales and Fuel Cost on page 342) Solution: normalize (standardize) the data first • Subtract mean, divide by std. deviation • Also called z-scores (i.e., from Normal Curve) Math Normalization is NOT the same thing as Database Normalization
Example: Normalization For 22 utilities: Avg. sales = 8,914 Std. dev. = 3,550 Normalized score for Arizona sales: (9,077-8,914)/3,550 = 0.046
Minimum Distance (Cluster A to Cluster B) • Also called single linkage • Distance between two clusters is the distance between the pair of records Ai and Bj that are closest Single Linkage Cluster B Cluster A
Maximum Distance (Cluster A to Cluster B) • Also called complete linkage • Distance between two clusters is the distance between the pair of records Ai and Bj that are farthest from each other CompleteLinkage Cluster B Cluster A
Average Distance • Also called average linkage • Distance between two clusters is the average of all possible pair-wise distances
Centroid Distance • Distance between two clusters is the distance between the two cluster centroids. • Centroid is the vector of variable averages for all records in a cluster CentroidDistance Cluster B Cluster A
The Hierarchical Clustering Steps (Using Agglomerative Method) • Start with n clusters (each record is its own cluster) • Merge two closest records into one cluster • At each successive step, the two clusters closest to each other are merged Dendrogram, from bottom up, illustrates the process
Reading the Dendrogram See process of clustering:Lines connected lower down are merged earlier • 10 and 13 will be merged next, after 12 & 21 Determining number of clusters: For a given “distance between clusters,” a horizontal line intersects the clusters that are that far apart, to create clusters • e.g., at distance of 4.6 (red line in next slide), data can be reduced to 2 clusters -- The smaller of the two is circled • At distance of 3.6 (green line) data can be reduced to 6 clusters, including the circled cluster
Reading DendrogramsComparing Scatterplots to Dendrograms Distance between clusters Distance between records
Interpretation Goal: obtain meaningful and useful clusters Caveats: (1) Random chance can often produce apparent clusters (2) Different cluster methods produce different results Solutions: • Obtain summary statistics • Also, review clusters in terms of variables not used in clustering • Label the cluster (e.g., clustering of financial firms in 2008 might yield label like “midsize, sub-prime loser”)
Desirable Cluster Features Stability – are clusters and cluster assignments sensitive to slight changes in inputs? Are cluster assignments in partition B similar to partition A? Separation – check ratio of between-cluster variation to within-cluster variation (higher is better) Want this NOT this
K-Means Clustering Algorithm • Choose # of clusters desired, k • Start with a partition into k clusters Often based on random selection of k centroids • At each step, move each record to cluster with closest centroid • Recompute centroids, repeat step 3 • Stop when moving records increases within-cluster dispersion
K-means Algorithm: Choosing k and Initial Partitioning Choose k based on the how results will be used e.g., “How many market segments do we want?” Also experiment with slightly different k’s Initial partition into clusters can be random, or based on domain knowledge If random partition, repeat the process with different random partitions • K-means demo app on my website
XLMiner Output: Cluster Centroids We chose k = 3 4 of the 8 variables are shown
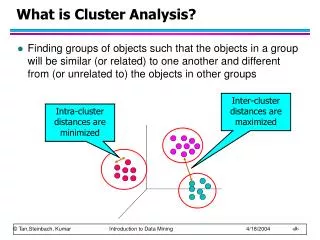
Distance Between Clusters Clusters 1 and 2 are relatively well-separated from each other, while cluster 3 not as much Want distance between clusters to be large 1 3 2
Within-Cluster Dispersion 1 Clusters 1 and 2 are relatively tight, cluster 3 very loose Conclusion: Clusters 1 & 2 well defined, not so for cluster 3 Want average distance within clusters to be small Next step: try again with k=2 or k=4 3 2
Summary • Cluster analysis is an exploratory tool. Useful only when it produces meaningful clusters • Hierarchical clustering gives visual representation of different levels of clustering • On other hand, due to non-iterative nature, it can be unstable, can vary highly depending on settings, is computationally expensive, and sensitive to outliers • Non-hierarchical is computationally cheap and more stable; requires user to set k • Can use both methods • Be wary of chance results; data may not have definitive “real” clusters