Download

1 / 51
510 likes | 651 Views
Setting service levels for utility networks. Phil Caffyn, Utility Consultants Ltd www.utilityconsultants.co.nz. Presentation topics. What sort of service levels do consumers really want. How utility networks create service levels.

E N D
Setting service levelsfor utility networks Phil Caffyn, Utility Consultants Ltd www.utilityconsultants.co.nz
Presentation topics www.utilityconsultants.co.nz
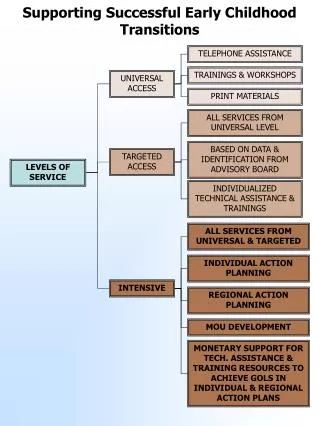
What sort of service levels do consumers really want. • How utility networks create service levels. • Why comparisons with industries that rely on inventory or processes are not really valid. • Developing a business model. • The basket of service levels. • Important consequences of the fixed asset model. • Defining primary, secondary & tertiary service levels – deciding what is important to consumers. • Setting service levels – what influences the asset-process mix. • Other issues that set or constrain service levels. • Justifying service levels. • Managing limited capital to maximise performance. • Towards the regulatory goal of economic efficiency. www.utilityconsultants.co.nz
What sort of service levelsdo consumers really want www.utilityconsultants.co.nz
Electricity consumer surveys performed early in 2006 gathered responses from… • 1,900 mass-market consumers in 3 geographical areas. • 193 large industrial consumers in 9 geographical areas. • Consumers were asked to indicate their 1st, 2nd and 3rd most important attributes from the following list… • Answering the phone quickly. • Keeping the power on all the time (continuity). • Quick processing of applications for new connections. • Advising on technical stuff. • Getting the power back on quickly (restoration). • No flicker or surges. • Sufficient notice of planned shutdowns. www.utilityconsultants.co.nz
Consumer responses were... • Most important attribute – continuity, usually by a wide margin in most geographical sub-areas. • Second most important attribute – restoration, but with no flicker or surge in some geographical sub-areas. • Third most important attribute – generally no flicker or sufficient notice of planned shutdowns (tended to vary between geographical sub-areas). • This provides a strong mandate for AMP’s to focus firstly on continuity and then on restoration. www.utilityconsultants.co.nz
How utility networkscreate service levels www.utilityconsultants.co.nz
All organisations create service levels through different combinations of assets and processes... www.utilityconsultants.co.nz
Auto parts shop – key service level depends on inventory held in non-real time, with only minor processes needing to be done in real time. Overall consumer experience is more likely to relate to having the desired range of spares in stock rather than whether the selection and payment all goes perfectly smoothly. • Generally one quadrant will predominate... www.utilityconsultants.co.nz
Generally one quadrant will predominate... Consulting business – key service level depends on problem-solving processes that can generally occur over extended periods of time - very few assets involved, generally doesn’t need to be done in real time. www.utilityconsultants.co.nz
Generally one quadrant will predominate... Concert – key service level depends on the quality of the band. Even if the venue is comfortable, the ticketing process went well etc, the overall service experience is likely to be low if the band are rubbish. www.utilityconsultants.co.nz
Network utility – key service level depends on very expensive fixed assets working perfectly every second • Generally one quadrant will predominate... www.utilityconsultants.co.nz
Key conclusion is that network utility businesses are very different from most other sorts of businesses because they involve… • Fixed assets. • Real time. www.utilityconsultants.co.nz
Why comparisons with industries that rely on inventory or processes are not really valid www.utilityconsultants.co.nz
Much talk about creating incentives for network utilities to be “efficient”, to “deliver efficient market outcomes” etc. • Might even use the lofty terms like allocative, dynamic and productive efficiency (we will pick up on these terms a bit more later). • Comparisons with other industries have varying degrees of validity (mostly weak I suspect) – why is this ?? www.utilityconsultants.co.nz
Fixed assets generally have at least a few if not all of the following characteristics… • Geographically dispersed. • Typically have a low revenue density. • High ratio of fixed to variable costs. • Difficult to efficiently redeploy. • Generally economically inefficient to duplicate in the context of “side-by-side” competition – there are isolated exceptions in both gas and electricity but these tend to be focused on “cherry-picking” high value consumers. www.utilityconsultants.co.nz
Must operate in real time… • Second after second after second. • No interruptions. • No long smoko’s. • No days off crook. • No vacations. www.utilityconsultants.co.nz
Developing a business model www.utilityconsultants.co.nz
Key aspects of a network utility business model are… • Business receives cash. • Uses a wide range of processes and knowledge to convert that cash into fixed assets. • Operates those fixed assets in real time to create service levels (most important ones being continuity and restoration). • Sells those service levels across a consumer connection point (typically a fuse or a valve). www.utilityconsultants.co.nz
Business model will look something like this… www.utilityconsultants.co.nz
Two important features of this model are… • The features that improve the value of the consumer relationship eg. premium branding, bundling etc. • The features that erode the value of the consumer relationship eg. ill-conceived regulation or inconsistent policy environments. • For more info on this last point read my presentation from the Institution of Gas Engineers conference. www.utilityconsultants.co.nz
The basket of service levels www.utilityconsultants.co.nz
Buying network utility services is kind of like buying a basket of groceries – we fill up a basket with items like bread, milk, meat, fruit, vegetables etc. • However the network utility basket gets filled with “items” like continuity, restoration, absence of flicker & surge, likely time to process a new connection application, likely notice period for planned shutdowns, answer the phone within so many rings etc. • Remember – consumers have told us that the most important items in the basket are continuity and restoration. • Each month we pay for the basket of service levels (typically a mix of fixed and variable charges which is beyond the scope of this presentation). www.utilityconsultants.co.nz
Important consequencesof the fixed asset model www.utilityconsultants.co.nz
Recall from the previous slides that almost all of the network utility service delivery process depends on fixed assets operating in real time... www.utilityconsultants.co.nz
This heavy dependence on fixed assets gives rise to three features of network utility service levels directly related to the fixed assets… • Limited substitutability. Continuity and restoration are seen as most important, and consumers aren’t prepared to trade these off for quicker processing of new connection applications, quicker phone response etc. The practical effect is that expensive, inflexible fixed assets cannot be traded off against cheap, flexible processes. • Averaging. All consumers connected to the same asset will receive almost exactly the same levels of service (and therefore should pay exactly the same price). • Free-riding. Implication of the above is that any consumer who might be allowed to pay less will still receive the same service levels and hence free-rides those who pay the full cost of service provision. www.utilityconsultants.co.nz
Service levels that consumers have ranked as less important often can be enhanced by processes operating in either real or non-real time… • eg. a backlog of new connection applications can be worked thru’ by paying someone a few hours overtime. • eg. timeliness and accuracy of shut-down notices can be enhanced by sending the notice to the plant electrician or production manger (and not the accounts clerk in Auckland who might bundle it up with the invoices so it arrives the day after the shutdown). • eg. phones can be answered more quickly by diverting to a call bureau or by giving high-value consumers a dedicated (0800) number. www.utilityconsultants.co.nz
Having said that, service levels that consumers have rated as most important (continuity and restoration) which are heavily dependent on fixed assets can be also slightly enhanced by processes (typically real time)… • eg. large consumers can be sent a text message advising of likely outage duration. This can influence which contingency plan a large consumer might implement eg. early smoko versus send the entire shift home early, dump molten product before it solidifies etc. • Effect of that is to shift the bubble on the 2x2 matrix towards the other quadrants so that a bit more of the consumer experience is derived from processes. www.utilityconsultants.co.nz
Defining primary, secondary and tertiary service levels – deciding what is important to consumers www.utilityconsultants.co.nz
Research indicates that consumers are primarily interested in… • Continuity (by a long way). • Restoration. • These are the primary service levels. • Research also indicates that the following are not so important (but presumably if supply was 100% continuous then these issues might take on increased importance)… • Absence of flicker & surge. • Accuracy & timeliness of planned shut-downs. • These can be referred to as the secondary service levels. www.utilityconsultants.co.nz
Research goes on to indicate that the following attributes are along way down the list of importance… • Answering the phone quickly. • Quick processing of new connection applications. • Providing technical advice. • These can be referred to as tertiary service levels. • The tough bit of all this is that meeting consumers primary requirements depends heavily on expensive fixed assets that need to be kept running continuously. www.utilityconsultants.co.nz
Some additional insights into the “flicker” thing... • Community understanding of the causes of power flicker varies considerably – many respondents recognised that trees brushing against lines in the wind could cause flicker, but failed to recognise that birds or animals might also cause flicker. • Interesting disconnect between people’s understanding that other consumers plant might cause flicker but their own plant (their 1,200kW arc furnace or 200hp saw mill) couldn’t possibly cause flicker. • Seems to be “urban myths” surrounding flicker – in one particular instance a high proportion of respondents were convinced that a single item of plant belonging to one large consumer caused extensive flicker at almost exactly 8pm every week night – many respondents stated this like a proven fact !!! www.utilityconsultants.co.nz
Further probing of respondents indicated that in many geographical areas flicker was noticeable (by either people, by data logging apparatus, or by plant) but wasn’t actually a problem. • Mass-market surveys were segmented by grid exit point (GXP) which revealed differing levels of satisfaction in regard to flicker (weren’t enough data points in some of these areas to merit action without further study). www.utilityconsultants.co.nz
Setting service levels – what influences the asset-process mix www.utilityconsultants.co.nz
So far we have identified “what” consumers primarily want... • Continuity. • Restoration. • We now need to identify “how much” continuity and restoration consumers want (and it is obviously pointless to ask this in the absence of price, but it is surprisingly how many organisations do). • Respondents were asked which of the following four options they would prefer in regard to price and supply reliability (a vague term encompassing both continuity and restoration)… • Pay a bit less to receive a bit less. • Pay about the same to receive about the same. • Pay a bit more to receive a bit more. • Pay a lot more to receive a lot more. www.utilityconsultants.co.nz
Responses were as follows… • So over 80% of respondents prefer to pay about the same to receive about the same. • Mass-market result may be slightly skewed toward “bit less” as one entire region is somewhat “financially challenged” and another region included an “aged” population. • “Lot more” responses seem a bit dubious. www.utilityconsultants.co.nz
1.1% might move here • Putting these responses on a 2x2 grid… 8.6% might move here 81.6% prefer to stay here 8.6% might move here www.utilityconsultants.co.nz
Other issues that set orconstrain service levels www.utilityconsultants.co.nz
In addition to setting service levels in response to consumer wishes, several other classes of issues can indirectly set or constrain service levels… • Legacy asset decisions eg. materials, configurations. • Public safety eg. ground clearances, tree clearances, earthing, fencing & enclosures. • Amenity value eg. District Plan, Regional Plan, LTNZ requirements. • Industry regulation eg. information disclosure, price & quality thresholds. • Electrical interference eg. SWER load limitations, harmonic levels. www.utilityconsultants.co.nz
Justifying service levels www.utilityconsultants.co.nz
Information Disclosure requirements have required AMP’s to justify assets for several years. • Assets can be justified in the following ways… • Physical characteristics of assets eg. age, material, condition, configuration. These can be changed but generally only over a long time period. • Consumer preferences for price and supply continuity will justify a certain level of investment. • Constrained revenue will limit a utility’s ability to fund variations in service levels (slew rate ??) • Where an external agency imposes a requirement on a utility eg. a requirement for all new power lines to be underground may create a continuity level beyond what consumers want and are prepared to pay for. www.utilityconsultants.co.nz
Managing limited capitalto maximise performance www.utilityconsultants.co.nz
Previous sections have concluded that the outcome consumers want most is continuity. • Responses from the 193 large consumers surveyed in early 2006 reinforces that they would not be prepared to trade-off “less continuity” for “more restoration” ie. have more interruptions but of shorter duration. • This is strongly reflective of the nature of modern production processes – it is the occurrence of the interruption, not the duration that causes the problems. • The bad news is that continuity is very expensive to create because it is strongly influenced by the end-to-end integrity of all components - in contrast, restoration can combine a mixture of security (fixed assets) and repairs (processes). • So there doesn’t seem to be any way around the cold hard fact that the most valued consumer outcome is also the most expensive to create. www.utilityconsultants.co.nz
Many methods to improve supply continuity… • Replacing assets that show an increasing risk of failure. • Splitting feeders. • Tree trimming. • Moving poles and cabinets away from the carriage way. • Adding bird spikes. • Condition monitoring & preventive maintenance. • Some of the above methods will reduce the likelihood of an interruption (replacing assets, tree trimming), whilst other methods will reduce the number of consumers effected by an interruption (splitting feeders). • The precise contribution to continuity that each method gives will depend largely on the asset configuration. • This gives an obvious clue that each method applied to a particular circumstance will deliver a certain reduction in lost consumer minutes per $ of spend. www.utilityconsultants.co.nz
Towards the regulatory goalof economic efficiency www.utilityconsultants.co.nz
As a closing note it would be useful to consider the whole service level issue in the context of the present regulatory regime. • The broad thrust of economic efficiency is embodied in the purpose statement of s57E of the Commerce Act 1986 – “promote the efficient operation of markets related to electricity distribution and transmission services for the long term benefit of consumers”. • In its discussion paper dated 21 March 2002 the Commerce Commission considered that “efficient operation of markets” had three dimensions, viz… • Allocative efficiency wherein scarce resources are used to create the outcomes most wanted by society. • Productive efficiency wherein these most wanted outcomes are created with the minimum resource consumption. • Dynamic efficiency wherein producers are incentivised over time to move toward the above two efficient points. www.utilityconsultants.co.nz
These fancy theoretical definitions are fine, but what do they really mean for a pipes & wires utility at a day-by-day level ?? • Let’s try restating these definitions in engineering speak… • Allocative efficiency is where a utility delivers the service level outcomes that the majority of consumers want at a level they want and are prepared to pay for. • Productive efficiency is where the desired service level outcomes are delivered at minimum life-cycle cost. • Dynamic efficiency is where the regulatory regime provides ongoing incentives to continue delivering what the majority of consumers want (and are prepared to pay for) at the least life-cycle cost. • It would be fair to say that most if not all utilities are operating at or near high productive efficiency by firstly justifying the need for new assets and then efficiently purchasing those assets (but there will always be odd exceptions). www.utilityconsultants.co.nz
The consumer surveys (both large industrials and mass market) have revealed firstly what service level outcomes consumers want, and secondly how much they want (and are prepared to pay for)… • Continuity & restoration. • Pay about the same for about the same level of continuity and restoration. • Hence utilities can become more allocatively efficient by delivering about the same level of continuity & restoration in return for about the same price – the surveys suggest most utilities are already doing this well. • So what about the dynamic efficiency – are utilities being correctly incentivised to pursue both allocative and productive efficiencies ?? • Many of you will have a firm view on this which will no doubt be the subject of many on-going discussions. www.utilityconsultants.co.nz
Contact me for more info www.utilityconsultants.co.nz
Phone (07) 854-6541 • Mobile (021) 606-670 • Email phil@utilityconsultants.co.nz • Skype philcaffyn www.utilityconsultants.co.nz