Download
1 / 72
740 likes | 894 Views
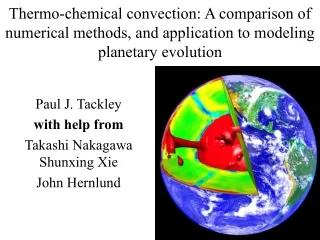
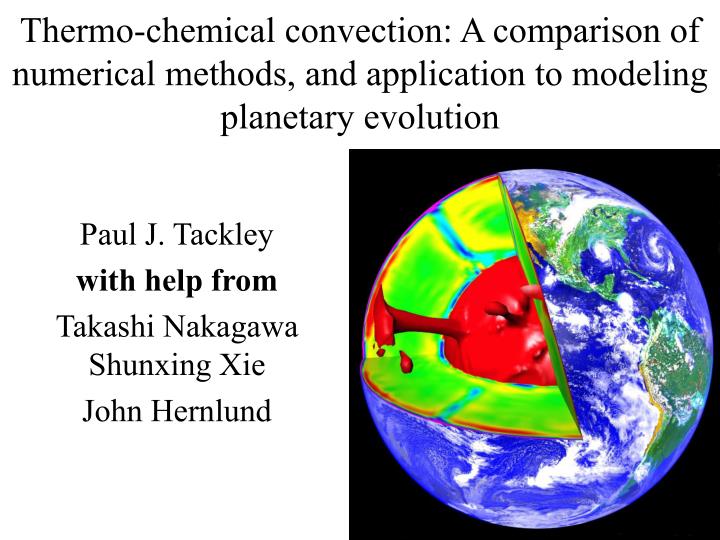
Thermo-chemical convection: A comparison of numerical methods, and application to modeling planetary evolution. Paul J. Tackley with help from Takashi Nakagawa Shunxing Xie John Hernlund. Plan. Numerical: benchmarks of methods for treating chemical field

E N D
Thermo-chemical convection: A comparison of numerical methods, and application to modeling planetary evolution Paul J. Tackley with help from Takashi Nakagawa Shunxing Xie John Hernlund
Plan • Numerical: benchmarks of methods for treating chemical field • Scientific: results of Earth thermo-chemical evolution models
Benchmark 1: van Keken et al, JGR 1997 • Transient Rayleigh-Taylor instability with different viscosity contrasts, or fairly rapid entrainment of a thin layer • Challenging. No two codes agree perfectly for long-term evolution. • Show example results for my code (FV multigrid, tracers hold composition)
BM2: Tackley and King, Gcubed 2003 • Model layer with long-term stability: test how convective pattern and entrainment varies with numerical details • Compare two underlying solvers: STAG3D (FD/FV multigrid) and CONMAN (FE) • Compare two tracer methods with field-based methods
Two tracer methods • ‘Absolute’: tracers represent dense material, absence of tracers represents regular material. ‘C’ proportional to #tracers/cell • Pro: C is conserved • Con: C can exceed 1 • ‘Ratio’: two types of tracer, one for dense material one for regular material C=#dense/(#dense+#regular) • Pro: C cannot exceed 1 • Cons: C not perfectly conserved, need tracers everywhere
Grid-based advection methods • STAG: MPDATA with or without ‘Lenardic filter’ • CONMAN: FE with or without ‘Lenardic filter’
Initial condition (thermal) 2-D 3-D • Composition: layer 0.4 deep
Findings • Absolute method: considerable settling unless #tr/cell>40. Improved by truncation. • In contrast, ratio method gives visually correct solution with only 5 tracers/cell
Tracer results: CONMAN • Similar to STAG results
Grid-based methods: STAG and CONMAN • ‘Lenardic’ filter helps a lot. Thanks Adrian.
Long-term layering BM: Conclusions • Tracer ratio method allows fewer tracers/cell than tracer absolute method • Grid-based methods can be competitive with enough grid points • Not clear that all methods are converging to the same solution as resolution is increased!
Need melting+eruption benchmark? • Melt=> surface crust, but what about compaction? • Place crust tracers in upper 8 km, ignore compaction (Christensen & Hoffman 1994) • Use inflow free-slip boundary condition (unreasonable high stresses) • Place crust at free-slip top, assume stress-free vertical compaction • Place crust at top, use free surface with viscoelastic rheology (best?)
Part 2- Science : Main points • C highly heterogeneous - a mess • Not much ‘pyrolite’- mostly strips of basalt and residue • Not much difference between the upper and lower mantles • Chemical heterogeneity has a different spectrum from thermal and dominates at most wavelengths • Post-perovskite transition anticorrelated with “piles” • The nature of chemical layering hinges on uncertain mineral physics parameters (partic. densities) and must be resolved by better data or by observation+modeling • Presence or absence of dense layering above the CMB has strong implications for core thermal evolution and mantle geotherm • Convection models can generate synthetic geochemical data to act as a further constraint
Cartoon models: different regions appear to be internally pretty homogeneous
Numerical models often start with clean layering, each layer internally homogeneous • Tackley, 1998 • (green=C)
Heterogeneity continuously produced by melting-induced differentiation • Differentiation by partial melting + crust production • Major elements (density differences) • Trace elements partition between melt+solid • Radiogenic ones most useful • He, Ar outgassed on eruption • Mixing/stirring by convection • Homogenizes material to lengthscale < melting region on timescale=?? Coltice & Ricard
T phase C
Most of the mantle has differentiated by MOR melting: how much? • Outgassing of nonradiogenic noble gases: >90% • Davies 2002: >97% • => only a few % primitive unprocessed material left • => at the grain scale, not much ‘pyrolite’ but rather strips of former MORB and depleted residue
Laboratory stretching Metcalfe, Bina and Ottino, 1995 In Earth, ‘blobs’ are continuously introduced
How long does it take to get mixed together again? • Old estimates of mixing time of 100s Myr were based on thinning ‘blobs’ by a factor ~50 • But thinning to ~cm scale is necessary for remixing at the grain scale, which means thinning by factor ~10^5 for oceanic crust • This takes at least 2 billion years to accomplish by convection! (see next graph) • Perhaps 50% of processed material has been stretched to the cm scale (but still not ‘average mantle’)
Chemical heterogeneity has a different spectrum from thermal heterogeneity and will dominate at shorter wavelengths and perhaps at long wavelengths too
Total vs spectrum T spectrum C spectrum
Recent probabilistic seismic inversion finds that composition dominates long-wavelength seismic signal in lower mantle
T phase C
Post-perovskite transition anticorrelated with possible ‘piles’ of dense material Hernlund et al., 2005
Is there a chemical difference between upper and lower mantles?
If ‘660’ assumes 100% olivine, there is an early layered phase
With both olivine and pyroxene systems, no early layered phase but… 1 Ga 2 Ga 3 Ga T C age Time
Local stratification builds up around 660 because of… 3.6 Ga T m=238U/204Pb C 206Pb/204Pb age 147Sm/144Nd
Different depths of perovskite transition in olivine and pyroxene systems • From Ita and Stixrude
Experimentally-measured basalt densities: Ono et al 2001 • Becomes less dense at greater depth?
The nature of chemical layering hinges on uncertain mineral physics parameters (e.g., densities) and must be resolved by better data or by observation+modeling
Approximation: 2 systems with different phase transitions • Dense • Neutral • Less dense (buoyant)
Effect of deep mantle crustal density buoyant dense neutral T C 3He/ 4He
Presence or absence of dense layering above the CMB has strong implications for core thermal evolution and mantle geotherm
CMB heat flow either drops to zero (global layer) or inner core grows too big! Nakagawa & Tackley, Gcubed in press