Download
1 / 15
150 likes | 313 Views
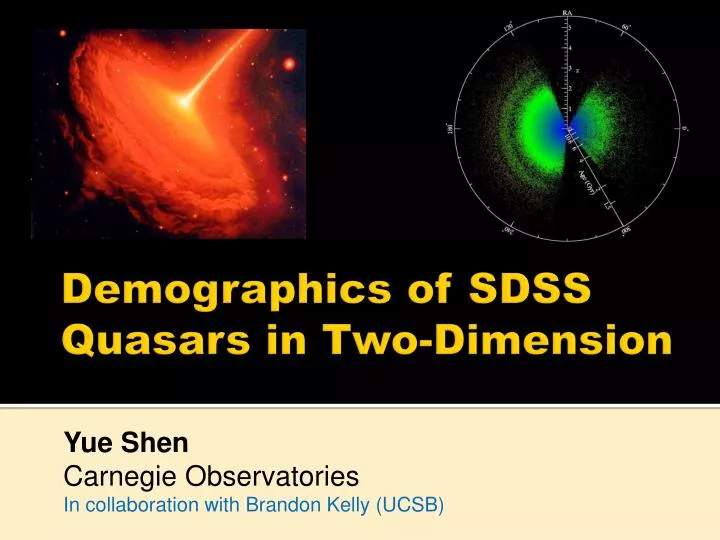
Yue Shen Carnegie Observatories In collaboration with Brandon Kelly (UCSB). Demographics of SDSS Quasars in Two-Dimension. M otivation. T he abundance (and clustering) of quasars are key to understand the evolution of quasars/SMBHs in the hierarchical structure formation paradigm

E N D
Yue Shen Carnegie Observatories In collaboration with Brandon Kelly (UCSB) Demographics of SDSS Quasars in Two-Dimension
Motivation • The abundance (and clustering) of quasars are key to understand the evolution of quasars/SMBHs in the hierarchical structure formation paradigm • Abundance measurements form a basis for any cosmological quasar models • Likely tied to formation and evolution of galaxies • Key science goal in many current and upcoming extragalactic survey programs
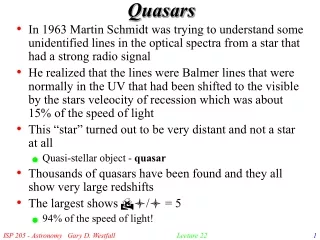
Quasar Luminosity Function Evolves strongly with redshift The space density of bright quasars peaks around z~2-3 Richards et al. (2006, SDSS DR3)
Z= For bright quasars, the abundance follows a “pure luminosity evolution” (PLE) a fading, long-lived quasar population? PLE Such a simple picture doesn’t fit other observations. SDSS DR7 LF (Shen & Kelly 2012)
Quasar clustering measurements suggest low-z quasars are not simply the descendants of high-z quasars Dashed lines: predicted evolution of the linear bias for a passive population z~2 quasars should end up in cluster-sized environment at z~0.5 YS, McBride, White, Zheng, et al. (2013)
Quasars evolve in the mass-luminosity plane • A better representation of the evolution of the quasar population • Contains richer information about the growth of SMBHs Virial masses
Estimating quasar BH masses The broad-line region (BLR) is assumed to be virialized BLR size (reverberation mapping) Virial velocity Reverberation mapping is time consuming, and we only have BLR size measured this way for ~40 AGNs
Reverberation mapping R~Lb (Kaspi et al. 2000) b~0.5, Consistent with naive predictions of photoionization models Bentz et al. (2009)
Single-epoch virial BH mass estimators • Vestergaard & Peterson(2006), McLure & Dunlop (2004), Greene et al. (2005), and many more … • Currently the only practical method to estimate BH mass for large spectroscopic quasar samples • Many physical and practical concerns that need to be addressed (Shen 2013): we are extrapolating from ~40 local AGNs with reverberation mapping data to high-z, high-luminosity quasars • Large uncertainties for individual BH mass estimates: ~ a factor of 3 (~0.5 dex) Broad line width Continuum luminosity
Quasar abundance in the mass-luminosity plane The sample used: ~58,000 uniformly selected DR7 SDSS quasars, with good spectra to estimate BH mass Two major problems: Flux limit of the sample Scatter in BH mass due to errors in mass estimates Virial masses
Forward modeling in the mass-luminosity plane (Shen & Kelly 2012, Kelly & Shen 2013) • Flux limit and mass errors are more easily accounted for • More information is preserved True BH masses
BHMF LF • Caveats: • SDSS only probes the tip of the quasar population, poorly constraining the faint-end of the LF and the low-mass end of the BHMF – need deeper data • Systematic uncertainties of quasar BH mass estimates have dramatic effects on the BHMF estimates – need to improve the BH weighing method
Properly accounting for the selection effect of flux-limited samples and errors in the virial BH mass estimates Eddington limit Interpret the “observed distributions” with caution Flux limit Red: true mass Black: virial mass estimates
Summary • Instead of measuring LF and BHMF separately, measure 2D density in the M-L plane (if you have a spectroscopic sample); this gives you more information on the evolution of the quasar population • Forward modeling in the M-L plane makes it easier to account for the sample flux-limit and errors in mass estimates • The “observed” distribution in the M-L plane is biased; don’t interpret it directly! • There is urgent need to improve quasar BH mass weighing methods (~0.5 dex error is inconvenient)