Download
1 / 5
50 likes | 197 Views
The following data was collected from a business that sells telephone systems. The bar graph shows the number of phone systems sold, in thousands, during the given years. Try these questions on your own. The answers follow. 1. In what year were the most phone systems sold?

E N D
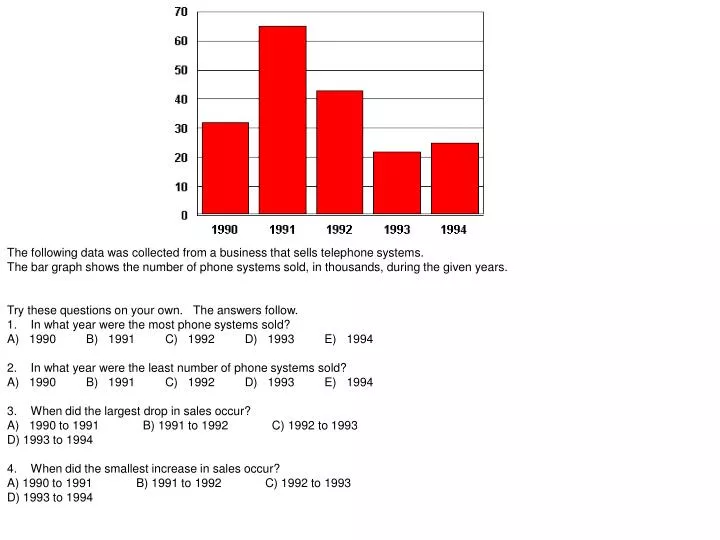
The following data was collected from a business that sells telephone systems. The bar graph shows the number of phone systems sold, in thousands, during the given years. Try these questions on your own. The answers follow. 1. In what year were the most phone systems sold? A) 1990 B) 1991 C) 1992 D) 1993 E) 1994 2. In what year were the least number of phone systems sold? A) 1990 B) 1991 C) 1992 D) 1993 E) 1994 3. When did the largest drop in sales occur? A) 1990 to 1991 B) 1991 to 1992 C) 1992 to 1993 D) 1993 to 1994 4. When did the smallest increase in sales occur? A) 1990 to 1991 B) 1991 to 1992 C) 1992 to 1993 D) 1993 to 1994
Double bar graph. The following graph represents sales for a certain company for the 1st, 2nd, 3rd, and 4th quarters of 1990 and 1991. 1. Find the number of sales in the 3rd quarter of 1990. 4,000 5,000 6,000 7,000 5,500 2. Find the number of sales in the 2nd quarter of 1991. 4,000 5,000 6,000 7,000 8,000 3. Find the number of sales in the 2nd and 4th quarter of 1990 10,000 15,000 6,000 11,000 9,000
The above Line graph depicts sales for two Real estate agents during the years 1990 - 1995. 5a. Find the number of houses sold by Ms. Smith in 1993. 40 50 30 20 80 5b. Find the number of houses sold by Ms. Smith and Mr. Jones in 1992. 50 40 30 20 80 5c. In what year did Ms. Smith and Mr. Jones sell the same number of houses? 1990 1991 1992 1993 1994
The above bar graph shows the income in millions for each company. Find the income change in millions for company C from 1994 to 1996. By how many millions did the income of Company A increase from 1995 to 1996?
The above bar graph represents the number of students at a college with the majors of Math, English and History. How many English majors were there between 1994 and 1996? In 1996, about how many more students majored in Math than in History?