Download
1 / 36
360 likes | 506 Views
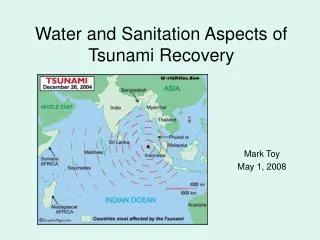
The global water and sanitation challenge: progress in meeting the Millennium Development Goals. Keynote address at Focusing Arizona’s Water Research (Arizona Water & Pollution Control Association, Arizona Water Institute), Phoenix, Oct. 29, 2008. THE GLOBAL WATER AND SANITATION CHALLENGE

E N D
The global water and sanitation challenge: progress in meeting the Millennium Development Goals Keynote address at Focusing Arizona’s Water Research (Arizona Water & Pollution Control Association, Arizona Water Institute), Phoenix, Oct. 29, 2008.
THE GLOBAL WATER AND SANITATION CHALLENGE Progress in Meeting the Millennium Development Goals Christopher Scott University of Arizona cascott@email.arizona.edu
THE CRISIS Acknowledgment: Anthony Rock, Arizona State University bud.rock@asu.edu
HEALTH - 50% of world’s hospital beds from water-related illness - diarrhea kills 1.8 million / year (17% under age 5 children’s deaths in developing world) ECONOMIC PRODUCTIVITY -diarrhea alone accounts for annual loss of 62 million Disability Adjusted Life Years (DALYs) - meeting MDG’s can save $90 million annually - each dollar invested in supply and sanitation yields $3-34 return
Contribution of Water/Sanitation • to Millennium Development Goals • (targets to achieve by 2015) • • MDG 1 Eradicate extreme poverty and hunger 30% • MDG 2 Achieve universal primary education 30% • MDG 3 Promote gender equality and empower women 20% • MDG 4 Reduce child mortality 30% • MDG 5 Improve maternal health 45% • MDG 6 Combat HIV/AIDS, malaria and other diseases 25% • MDG 7 Ensure environmental sustainability >50% • MDG7, Target 3: Reduce by half the proportion of people worldwide without safe drinking water and basic sanitation
Sobering Demographics • 880 million additional population by 2015, virtually all in developing countries. • After 2015, all worldwide growth in population will take place in developing country cities.
Urban Explosion • India will soon cross the 50-50 urban-rural population threshold… 750 million urban Indians by 2050. • China is actively planning for cities each with more than 100 million population. • Africa’s urban population growth rates among the highest in the world. • Latin America has been predominantly urban for generations.
Urban Water Supply Growth Millennium Development Goals face resource constraints (water, investment). Progress towards sanitation goals lagging behind water supply; therefore, wastewater management is critical.
In 1990 - 23% of the world’s population lacked safe drinking water and 51% lacked adequate sanitation. Today - roughly 1.1 billion people still live in conditions of water stress or scarcity; 2.6 billion people lack any improved sanitation facilities. MDG Challenge - Supply water to 1.2 billion additional people (100 million / yr or 260,000 / day) - Provide sanitation to 1.8 billion (180 million / yr or 400,000 / day)
DRINKING WATER COVERAGE Between 1990-2002, access rose from 77% to 83%
SANITATION COVERAGE Between 1990-2002, coverage rose from 49% to 58%
FINANCING GLOBAL WATER GOALS • ESTIMATED COSTS TO MEET THE 2015 WATER AND SANITATION TARGETS (HIGHLY VARIABLE) • $10-12 BILLION (WHO-UNICEF) • – water access and basic sanitation • $49 BILLION (Camdessuss Report) • – full water ($17bill), sewage connections and • primary wastewater treatment ($32bill) • $180 BILLION (World Water Commission) • – maintain full water supply (drinking, agriculture, energy, industry) • and sanitation needs by 2025
SOURCES OF GLOBAL WATER FINANCING • 64 % - Domestic public sector financing at the national or local level (from taxes, user fees, public debt, etc.) • 19% - Direct investments from domestic private sources • 5% - Direct investments from international private sources • 12% - International sources of support and cooperation (including multilateral and bilateral Official Development Assistance)
USG INVESTMENT FY 2003-2005 $1.7 BILLION IN OFFICIAL DEVELOPMENT ASSISTANCE 100 WATER AND RELATED PROJECTS 24 MILLION PEOPLE RECEIVED IMPROVED WATER ACCESS 26 MILLION PEOPLE RECEIVED ACCESS TO IMPROVED SANITATION 15 USG AGENCIES AND DEPARTMENTS SUPPORTED INTERNATIONAL WORK (WITH VIRTUALLY NO DIRECT APPROPRIATIONS) KEY AREAS INCLUDED: AFGHANISTAN, BANGLADESH, COLOMBIA, EGYPT, ETHIOPIA, HAITI, INDIA, INDONESIA, KENYA, NEPAL, PAKISTAN, PHILIPPINES, SOMALIA, SUDAN, UGANDA, NILE BASIN, OKAVANGO BASIN
ESTIMATED FINANCIAL SUPPORT FOR GLOBAL WATER PROGRAMS BY LEADING USG FUNDER, FY2005 USAID $397.7 million Millennium Challenge Corporation $89.9 million Environmental Protection Agency $79.3 million Department of State $36.0 million Department of Defense $3.4 million total >$600 million (figure excludes Iraq and Afghanistan – additional $290 million) (loans, guarantees, and insurance can average an additional $200 million)
Selected International Organizations Fiscal Year 2005 Organization U.S. Contribution % of Core Budget to Core Budget Spent on Water UNICEF $342.00M 10.4% WHO $96.11M 1.9% UNESCO $77.00M 8.1% UNDP $108.00M 13.1% WMO $11.00M 4.6% UNEP $6.00M 12.3% FAO $81.62M 0.8% Total $721.73M (The U.S. does not earmark contributions to core budget, but by comparative percentage $36.6M was spent on water programs.)
Senator Paul Simon Water for the Poor Act (Public Law 109-121) signed into law on November 30, 2005. • Key Objectives: • increase the amount of funds available for water and sanitation, • support innovative funding mechanisms, greater international coordination, and better integration of water and sanitation into other development efforts, • require the development of a strategy to meet specific goals and benchmarks on the way to halving the percentage of people without access to safe water and sanitation.
IMPLICATION: WASTEWATER • Treatment not part of MDGs • National finance woefully inadequate (e.g., India $7 billion investment is 10% of needed) • Most existing plants not working (Ghana 7 plants working of 57 total)
ACCRA CONSENSUS - OCT. 2008 • 30 international, regional, national research institutes, multilateral and bilateral bodies, and universities based in 17 countries recommend: • Integrate health and economic impact assessments • Facilitate the adoption of the 2006 World Health Organization guidelines for the safe use of wastewater, excreta and greywater • Increase human, institutional, and technical capacities in low-income countries • Facilitate the exchange of information on best practices
Wastewater Use: Conclusions • Urban growth + high treatment costs = increasing agricultural reuse • Promote beneficial agricultural reuse • Mitigate health and environmental risk
Risk Mitigation • Secondary treatment (biosolids handling enforcement is essential) • Application method to limit irrigators’ exposure • Market wash water and handling • Crop restrictions – non-edible and fodder. Limit fresh produce irrigation, e.g.:
Treatment for Compliance • WHO - 103 faecal coliforms/100 ml • Cost of treating raw sewage used for direct irrigation to meet WHO standard is approx US$125 per case of infection (of hepatitis, rotavirus, cholera, or typhoid) prevented (Fattal, Shuval, Laempert, 2004). • USEPA – zero incremental risk • Incremental cost of further treating wastewater from WHO to USEPA standard approx. US$450,000 per case of infection prevented (Fattal, Shuval, Laempert, 2004).
Policy Implications • Planned reuse offers no easy solutions • Key to success are: • coherent legal and institutional framework • coordination of multiple government agencies • flexible application of the ‘polluter pays’ principle • extension to farmers of appropriate practices for wastewater use • public awareness campaigns to build social acceptability for reuse