Download
1 / 70
710 likes | 974 Views
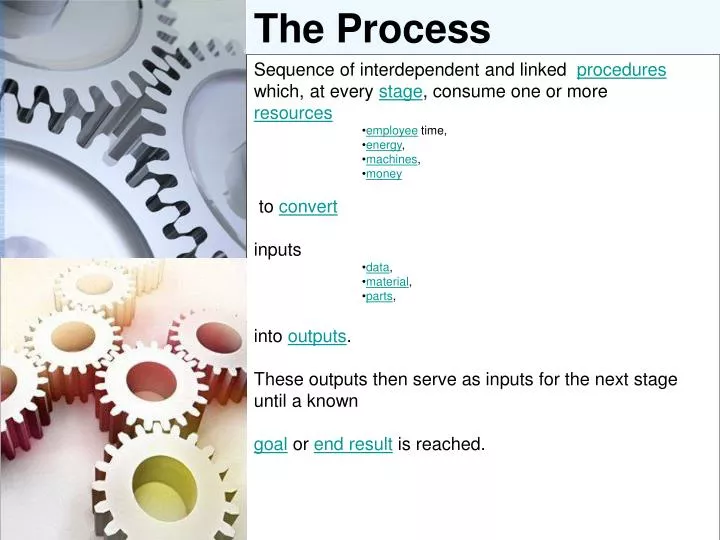
The Process. Sequence of interdependent and linked procedures which, at every stage , consume one or more resources employee time, energy , machines , money to convert inputs data , material , parts , into outputs .

E N D
The Process • Sequence of interdependent and linked procedures which, at every stage, consume one or more • resources • employee time, • energy, • machines, • money • to convert • inputs • data, • material, • parts, • into outputs. • These outputs then serve as inputs for the next stage until a known • goal or end result is reached.
The Expertise Transport Etihad Airlines Fly Dubai GoIndigo IRS Vijay Tanks Air India Qantas Manufacturing and Auto BHEL HM-Mitsubishi Hundai MUL LUCAS-TVS Govt KSEB Air India NPCL Power Projects Services Marriot TVS S&S Education NIT BIM, Trichy Thought Works Oil & Gas ARIES Marine, UAE NITC, Iran Mactaggart Scott, UK ONGC PEMCO, Qatar
The Expertise • M.Tech – Quality, Reliability, OR • Certified Quality Engineer / MBB– ASQ • More than 3000 Improvement Projects • Last 1 year revenue impact above 2 Billion USD • Application in 30 domains with support consultants • Lead consultant for Qualimations in Gulf/India/Africa • 20 years application and support
The Process • Sequence of interdependent and linked procedures which, at every stage, consume one or more • resources • employee time, • energy, • machines, • money • to convert • inputs • data, • material, • parts, • into outputs. • These outputs then serve as inputs for the next stage until a known • goal or end result is reached.
The Process • Sequence of interdependent and linked procedures which, at every stage, consume one or more • resources • employee time, • energy, • machines, • money • inputs • data, • material, • parts, • These outputs then serve as inputs for the next stage until a known • goal or end result is reached. into outputs.
The Process • Sequence of interdependent and linked procedures which, at every stage, consume one or more • resources • employee time, • energy, • machines, • money • inputs • data, • material, • parts, • These outputs then serve as inputs for the next stage until a known • goal or end result is reached. into outputs. f
The Process • Sequence of interdependent and linked procedures which, at every stage, consume one or more • resources • employee time, • energy, • machines, • money • inputs • data, • material, • parts, outputs.
The Process • Sequence of interdependent and linked procedures which, at every stage, consume one or more • resources • employee time, • energy, • machines, • money • inputs • data, • material, • parts, outputs. Vibration Climate Holidays Breakdown
The Process • employee time, • energy, • machines, • money • inputs • data, • material, • parts, Controllable Factors • Outputs • Characteristics Vibration Climate Holidays Breakdown Non Controllable Factors
The Process Controllable Factors Employee time energy Machines Money • inputs • data, • material, • parts, • Outputs • Characteristics Vibration Climate Holidays Breakdown Non Controllable Factors
The Process Outputs Controllable Factors Target Employee time energy Machines Money • inputs • data, • material, • parts, 3.75 mm 0.03 mm Vibration Climate Holidays Breakdown USL:3.78 LSL:3.72 Non Controllable Factors
The Process Outputs Controllable Factors Target Employee time energy Machines Money • inputs • data, • material, • parts, 3.75 mm 0.03 mm Vibration Climate Holidays Breakdown USL:3.78 LSL:3.72 Non Controllable Factors
The Process Outputs Controllable Factors Target Employee time energy Machines Money • inputs • data, • material, • parts, 3.75 mm 0.03 mm Vibration Climate Holidays Breakdown USL:3.78 LSL:3.72 Non Controllable Factors
The Process Outputs Controllable Factors Target Employee time energy Machines Money • inputs • data, • material, • parts, 3.75 mm 0.03 mm Vibration Climate Holidays Breakdown USL:3.78 LSL:3.72 Non Controllable Factors
The Process Outputs Controllable Factors Target Employee time energy Machines Money • inputs • data, • material, • parts, 3.75 mm 0.03 mm Vibration Climate Holidays Breakdown USL:3.78 LSL:3.72 Non Controllable Factors
The Process Outputs Controllable Factors Target Process characteristics Employee time (LESS,HIGH) energy (LOW,MEDIUM,HIGH) Machines ( M1,M2) Money (LOW,HIGH) • inputs • Data(TABULATED,NONTABULATED) • Material(TYPE1,TYPE2), • Parts( PARTA, PARTB), 3.75 mm 0.03 mm Cost Vibration ( DEPENDEND ON TIME) Climate (DEPENDED ON SEASON) Holidays (DIFFERS) Breakdown (RESOURSE ON MAINTANENCE) Incoming source of variation USL:3.78 LSL:3.72 Product characteristics Non Controllable Factors A product characteristic is a feature of the product that must be controlled, such as a dimension, a color, or contamination. Each product characteristic should have at least one process characteristic that is associated with it. The process characteristic is the feature or element of the process that affects or controls the product characteristic in question. For example, a product characteristic might be a drilled/bored hole of a certain size and location, and the associated process characteristics might be proper drill size, drill sharpness, and the method used to locate the hole in the machine. The goal should be to identify, optimize and control the process characteristics so as to avoid having to inspect product characteristics. That's what process control is all about.
The Process Outputs Controllable Factors Target Employee time (LESS,HIGH) energy (LOW,MEDIUM,HIGH) Machines ( M1,M2) Money (LOW,HIGH) • inputs • Data(TABULATED,NONTABULATED) • Material(TYPE1,TYPE2), • Parts( PARTA, PARTB), 3.75 mm 0.03 mm Vibration ( DEPENDEND ON TIME) Climate (DEPENDED ON SEASON) Holidays (DIFFERS) Breakdown (RESOURSE ON MAINTANENCE) USL:3.78 LSL:3.72 Non Controllable Factors
The Process Outputs Controllable Factors Target Employee time (LESS,HIGH) energy (LOW,MEDIUM,HIGH) Machines ( M1,M2) Money (LOW,HIGH) • inputs • Data(TABULATED,NONTABULATED) • Material(TYPE1,TYPE2), • Parts( PARTA, PARTB), 3.75 mm 0.03 mm Vibration ( DEPENDEND ON TIME) Climate (DEPENDED ON SEASON) Holidays (DIFFERS) Breakdown (RESOURSE ON MAINTANENCE) USL:3.78 LSL:3.72 Non Controllable Factors
The Process Outputs Outputs Outputs Target Target Target 0.03 mm 0.03 mm 0.03 mm USL:3.78 LSL:3.72 USL:3.78 LSL:3.72 USL:3.78 LSL:3.72 Sigma=3.25 Sigma=3.03 Sigma=2.56
The Process Outputs Outputs Outputs Target Target Target 0.03 mm 0.03 mm 0.03 mm USL:3.78 LSL:3.72 USL:3.78 LSL:3.72 USL:3.78 LSL:3.72 Sigma=3.25 Sigma=3.03 Sigma=2.56
The Process Outputs Controllable Factors Target Employee time (LESS,HIGH) energy (LOW,MEDIUM,HIGH) Machines ( M1,M2) Money (LOW,HIGH) • inputs • Data(TABULATED,NONTABULATED) • Material(TYPE1,TYPE2), • Parts( PARTA, PARTB), 3.75 mm 0.03 mm Vibration ( DEPENDEND ON TIME) Climate (DEPENDED ON SEASON) Holidays (DIFFERS) Breakdown (RESOURSE ON MAINTANENCE) USL:3.78 LSL:3.72 Non Controllable Factors
The Process Outputs Controllable Factors Target Employee time (LESS,HIGH) energy (LOW,MEDIUM,HIGH) Machines ( M1,M2) Money (LOW,HIGH) Process Average • inputs • Data(TABULATED,NONTABULATED) • Material(TYPE1,TYPE2), • Parts( PARTA, PARTB), 3.75 mm 0.03 mm Vibration ( DEPENDEND ON TIME) Climate (DEPENDED ON SEASON) Holidays (DIFFERS) Breakdown (RESOURSE ON MAINTANENCE) Process variation USL:3.78 LSL:3.72 Non Controllable Factors
The Process Outputs Process Average Controllable Factors Target Employee time (LESS,HIGH) energy (LOW,MEDIUM,HIGH) Machines ( M1,M2) Money (LOW,HIGH) • inputs • Data(TABULATED,NONTABULATED) • Material(TYPE1,TYPE2), • Parts( PARTA, PARTB), 3.75 mm 0.03 mm Vibration ( DEPENDEND ON TIME) Climate (DEPENDED ON SEASON) Holidays (DIFFERS) Breakdown (RESOURSE ON MAINTANENCE) Process variation USL:3.78 LSL:3.72 Non Controllable Factors
The Process Outputs Process Average Controllable Factors Target Employee time (LESS,HIGH) energy (LOW,MEDIUM,HIGH) Machines ( M1,M2) Money (LOW,HIGH) • inputs • Data(TABULATED,NONTABULATED) • Material(TYPE1,TYPE2), • Parts( PARTA, PARTB), 3.75 mm 0.03 mm Vibration ( DEPENDEND ON TIME) Climate (DEPENDED ON SEASON) Holidays (DIFFERS) Breakdown (RESOURSE ON MAINTANENCE) Process variation USL:3.78 LSL:3.72 Non Controllable Factors
The Process Problem Outputs Process Average Target 3.75 mm 0.03 mm Process variation USL:3.78 LSL:3.72
The Process Problem Outputs Process Average Target 3.75 mm 0.03 mm Process variation USL:3.78 LSL:3.72
The Process Problem Outputs Current Outputs Expected Process Average Process Average Target Target 3.75 mm 3.75 mm 0.03 mm 0.03 mm Process variation Process variation USL:3.78 LSL:3.72 USL:3.78 LSL:3.72
The Process Outputs Current Controllable Factors Process Average Employee time (LESS,HIGH) energy (LOW,MEDIUM,HIGH) Machines ( M1,M2) Money (LOW,HIGH) Target • inputs • Data(TABULATED,NONTABULATED) • Material(TYPE1,TYPE2), • Parts( PARTA, PARTB), 3.75 mm Vibration ( DEPENDEND ON TIME) Climate (DEPENDED ON SEASON) Holidays (DIFFERS) Breakdown (RESOURSE ON MAINTANENCE) 0.03 mm Process variation Non Controllable Factors USL:3.78 LSL:3.72
The Process Controllable Factors Outputs Objective Employee time (LESS,HIGH) energy (LOW,MEDIUM,HIGH) Machines ( M1,M2) Money (LOW,HIGH) • inputs • Data(TABULATED,NONTABULATED) • Material(TYPE1,TYPE2), • Parts( PARTA, PARTB), Process average (center) Process Variation (Minimal) Vibration ( DEPENDEND ON TIME) Climate (DEPENDED ON SEASON) Holidays (DIFFERS) Breakdown (RESOURSE ON MAINTANENCE) Supplier Non Controllable Factors
Process Control Controllable Factors Outputs Objective Employee time (LESS,HIGH) energy (LOW,MEDIUM,HIGH) Machines ( M1,M2) Money (LOW,HIGH) • inputs • Data(TABULATED,NONTABULATED) • Material(TYPE1,TYPE2), • Parts( PARTA, PARTB), Process average (center) Process Variation (Minimal) Vibration ( DEPENDEND ON TIME) Climate (DEPENDED ON SEASON) Holidays (DIFFERS) Breakdown (RESOURSE ON MAINTANENCE) Supplier Non Controllable Factors
Process Control R chart control X chart control
Process Control Controllable Factors Outputs Objective Employee time (LESS,HIGH) energy (LOW,MEDIUM,HIGH) Machines ( M1,M2) Money (LOW,HIGH) • inputs • Data(TABULATED,NONTABULATED) • Material(TYPE1,TYPE2), • Parts( PARTA, PARTB), Process average (center) Process Variation (Minimal) Vibration ( DEPENDEND ON TIME) Climate (DEPENDED ON SEASON) Holidays (DIFFERS) Breakdown (RESOURSE ON MAINTANENCE) Supplier Non Controllable Factors Y = f(x): Process Outcome a Result of Process Inputs
Process Control Output Quality (Y) = F ( X1,X2,X3) X2: [ F1,F2,F3,F4….] Supplier Sheet Metal Slot width Controllable Factors Gage Input Output x2 2.04mm +/-0.3mm x1 Non Controllable Factors x3 3.06 mm +/- .03mm Measure of quality Quality of Slot width Y = f(x): Process Outcome a Result of Process Inputs
DMAIC Y = f(x): Process Outcome a Result of Process Inputs The mathematical term Y = f(x), which translates as simply Y is a function of x, illustrates the idea that the important process outcomes (Ys) are a result of the drivers (x‘s) within processes. The goal of DMAIC is to identify which few process and input variables mainly influence the process output measures. Each DMAIC phase can therefore be described by how it contributes to this goal: Define: Understand the project Y and how to measure it. Measure: Prioritize potential x‘s and measure x‘s and Y. Analyze: Test x-Y relationships and verify/quantify important x‘s. Improve: Implement solutions to improve Y and address important x‘s. Control: Monitor important x‘s and the Y over time.
DMAIC Y = f(x1,x2,x3,x4,x5……………….xn) Define: Understand the project Y and how to measure it. Y = f(x1,x2,x3,x4,x5……………….xn) VOC is used to verify the importance of the Y metric and to set specifications for the Y . Since the output column usually shows multiple Ys, VOC is again needed to determine which Y should be included in the project. The project charter delivers the Y by clearly stating what the business or process problem is. It also expresses the Y as a measurable process metric that tells how well the process is performing today (the baseline) and how performance should be after process improvement (the goal). • Voice of Customer • SIPOC SIPOC (suppliers, inputs, process, outputs, customers) diagram clearly links the project Y to the process output. The output column of the SIPOC shows which Y is a result of the process. In the input column, the SIPOC provides a list of potential Xs.
DMAIC Y = f(x1,x2,x3,x4,x5……………….xn) Define: Understand the project Y and how to measure it. Y = f(x1,x2,x3,x4,x5……………….xn) The business case finally links the project Y to the so called “Big Y.” This means it shows how achieving the project Y contributes to higher-level business objectives like financial targets, customer satisfaction or strategically relevant goals (on time to market, on-time delivery, inventory level, etc.). The project team can close the Define phase when it has a measurable, clearly defined Y with set specifications that help to distinguish between desired and not desired process performance.
DMAIC Y = f(x1,x2,x3,x4,x5……………….xn) Define: Understand the project Y and how to measure it. Y = f(x1,x2,x3,x4,x5……………….xn)
DMAIC Y = f(x): Process Outcome a Result of Process Inputs Measure: Prioritize potential x‘s and measure x‘s and Y. The Measure phase usually starts with a fishbone diagram and/or a detailed process mapping. Given the clearly defined Y from the Define phase, the fishbone helps to identify all potential causes (x‘s) of this Y; the detailed process mapping also shows which process x‘s mostly influence the process Y. At the end of this step, the project team should have a full picture of potential x‘s that it might next have to reduce to a manageable and measurable few.
DMAIC Y = f(x): Process Outcome a Result of Process Inputs Measure: Prioritize potential x‘s and measure x‘s and Y. It is always important to remember that the brainstorming, as well as the reduction of potential x‘s, happens based on process expertise, not yet on facts and data. As the next step, the team sets up a data collection plan that allows for measuring both x‘s and Y in such a way that the data collected can later be used to identify cause-and-effect (i.e., x-Y) relationships with the help of graphical and statistical tools. Of course, for all x‘s and Ys to be measured, an operational definition and – if possible – a gage R&R study should be conducted in order to guarantee reliable data. Having the x‘s and Y data collected, the team would now start identifying patterns in data. Usually control charts, time series plots, and frequency plots are used to separate common from special cause variation. X‘s that influence special cause variation are identified, and if they can be explained and avoided in the future, they are removed from the data set. Additionally, Pareto analyses where the Y is stratified by categories of one x help to further scope the project.
DMAIC Y = f(x): Process Outcome a Result of Process Inputs Measure: Prioritize potential x‘s and measure x‘s and Y. The final step in the Measure phase is to determine the baseline capability of the process Y: Yield, Cpk or process sigma values indicate how well the process Y is performing today. This also sometimes leads to re-setting the initially stated goals in the project charter. The Measure phase ends with related data for the Y and the most important x‘s, where x‘s of special cause variation have already been removed from the data set.
DMAIC Y = f(x): Process Outcome a Result of Process Inputs Measure: Prioritize potential x‘s and measure x‘s and Y. Y = f(x1,x2,x3,x4,x5……………….xn)
DMAIC Y = f(x): Process Outcome a Result of Process Inputs Analyze: Test x-Y relationships and verify/quantify important x‘s. In terms of x‘s and Ys, the Analyze phase is quite simple: All graphical tools (e.g., stratified frequency plots, pie charts, scatter plots, etc.) and statistical tools (hypothesis tests, regression analysis, design of experiments) that Green Belts and Black Belts learn during training have just one goal: Verifying and quantifying X-Y relationships.
DMAIC Y = f(x): Process Outcome a Result of Process Inputs Analyze: Test x-Y relationships and verify/quantify important x‘s. The large number of different tools available is simply because different data types (continuous or discrete) of x and Y require different tools, as illustrated in the figure below. In addition to this data door, the tools of the process door (waste analysis, value-added analysis) supplement the quantitative data analysis with a more qualitative analysis and confirmation of important process x‘s. At the end of the Analyze phase, the critical few x‘s that contribute most to the problem of the process Y are known.
DMAIC Y = f(x): Process Outcome a Result of Process Inputs Analyze: Test x-Y relationships and verify/quantify important x‘s. Y = f(x1,x2,x3,x4,x5……………….xn)
DMAIC Y = f(x): Process Outcome a Result of Process Inputs Improve: Implement solutions to improve Y and address important x‘s. Analog to the Measure phase, the Improve phase also starts with getting a full picture. This time it is a full picture of potential solutions that – by addressing the critical few x‘s – can help improve the Y. Brainstorming and creativity techniques help to generate these potential solutions. In order to reduce these solutions to those that should be implemented, each solution is rated against specific criteria.
DMAIC Y = f(x): Process Outcome a Result of Process Inputs Improve: Implement solutions to improve Y and address important x‘s. Two important criteria are how much a solution contributes to improving the Yand how much it addresses specific x‘s. (Of course other criteria, like easiness of implementation, costs, also are important.) Before starting the implementation of the improved process, a failure modes and effect analysis helps to identify ways that the process Y can fail and the potential causes (newly or previously identified x‘s) and how to prevent these failures from happening. At the end of the Improve phase, short-term data (e.g., from a pilot program) demonstrates that the identified solution or solution package has really improved the Y.
DMAIC Y = f(x): Process Outcome a Result of Process Inputs Improve: Implement solutions to improve Y and address important x‘s. Y = f(x1,x2,x3,x4,x5……………….xn)
DMAIC Y = f(x): Process Outcome a Result of Process Inputs Control: Monitor important x‘s and the Y over time. The Control phase ensures that the new performance of the Y is sustained over time. In order to achieve this, a process management chart is developed that shows the new process flow, offers critical check points during the process, and has recommended actions in case the process does not continue on target. In a process management chart, the previously identified x‘s are called leading indicators (i.e., checkpoints during the process) and the Y is the lagging indicator (i.e., the final checkpoint at the end of a process cycle).
DMAIC Y = f(x): Process Outcome a Result of Process Inputs Control: Monitor important x‘s and the Y over time. Additionally, a performance measurement and monitoring system or dashboard is established that helps the process owner to measure and control the critical leading (x‘s) and lagging (Y) indicators on a continuous base. Control charts are again the best tool to show the performance of the Y over time. After the handover of these tools to the process owner, the project is closed by evaluating the achieved results in terms of x‘s that were identified and the improvement in the Y.
DMAIC Y = f(x): Process Outcome a Result of Process Inputs Control: Monitor important x‘s and the Y over time. Y = f(x1,x2,x3,x4,x5……………….xn)