Download
1 / 19
190 likes | 329 Views
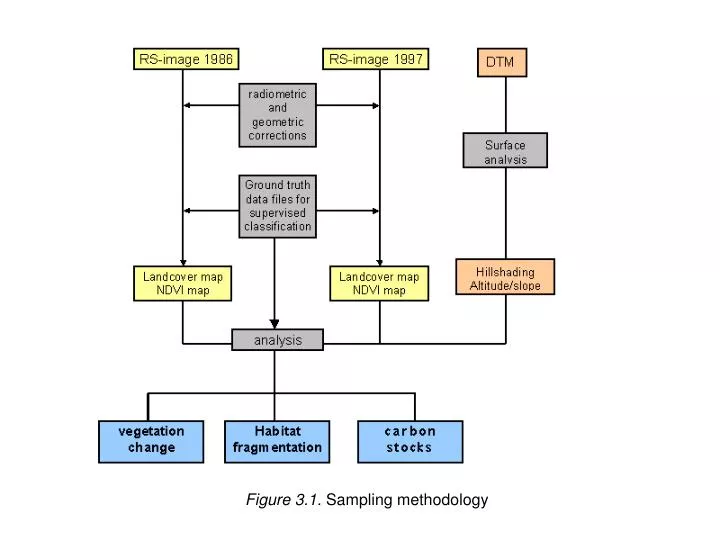
Figure 3.1. Sampling methodology. Figure 3.2. An overview of a typical Abies forest (photograph R.Bobbink). Figure 3.3. Open Pinus hartwegii forest near the timberline in the Iztac-Popo area (photograph R.Bobbink).

E N D
Figure 3.2. An overview of a typical Abies forest (photograph R.Bobbink).
Figure 3.3. Open Pinus hartwegii forest near the timberline in the Iztac-Popo area (photograph R.Bobbink).
Figure 3.4. Alpine bunchgrasslands (“zacatonal”) near the Iztaccíhuatl (photograph R.Bobbink).
Figure 3.5. Increase (left) and decrease (right) in fragmentation of the vegetation in the period 1986 to 1997. For a description of the method used, see text chapter 3.
Figure 3.8. Pattern of changes in vegetation types from 1986 (top left) to 1997 (bottom right) for the northern part of the Iztaccíhuatl. Black lines indicate roads.
Figure 3.9. Small-scale logging and collecting of trees still occurs in the Iztac-Popo area (photograph R. Bobbink).
Figure 3.10. Cutting small pieces out of the basal trunk of Pinus trees (“ocoteo”). This is done because these pieces with high resin content easily set fire. The weakened trees can become infected by an indigenous mistletoe (Arcethobium spp) (photographs R. Bobbink).
Figure 3.11. Picture of a large fire, even above the timberline, in the completely restricted area of the Iztac-Popo area (photograph R. Bobbink).
Figure 3.12. Overview of a heavily grazed Pinus hartwegii stand in the Iztac-Popo area at ca. 3500 m (photograph by R. Bobbink).
Figure 3.14. Overview of a highly eroded slopes at ca. 2800 m at the south-east part of the Iztac-Popo area (photograph by R. Bobbink).
Figure 3.15. Photochemical smog reaching the foothills of the Iztac-Popo area. Photograph has been taken at 2950 m on the western site of the mountains (R. Bobbink).
Figure 3.16.Vegetation and landuse cover after supervised classification of the Landsat-MSS image from January 1986.
Figure 3.17. Vegetation and landuse cover after supervised classification of the Landsat-TM image from February 1997.
Figure 3.18. Pattern of all observed transitions between 1986 and 1997 in the direction of decreasing forest density ('deforestation') above 2500 masl. For definition of the 5 combined vegetation classes, see text in chapter 3.
Figure 3.19. Pattern of all observed transitions between 1986 and 1997 in the direction of increasing forest density ('afforestation') above 2500 masl. For definition of the 5 vegetation classes, see text in chapter 3.