Download
1 / 1
10 likes | 101 Views
Environment Canada. Environnement Canada. MANTRA, Turnaround, and the University of Toronto’s Balloon-Borne Fourier Transform Spectrometer D. Wunch 1 , J. R. Drummond 1,2 , C. Midwinter 1 , J. R. Taylor 1 , D. Fu 3 ,

E N D
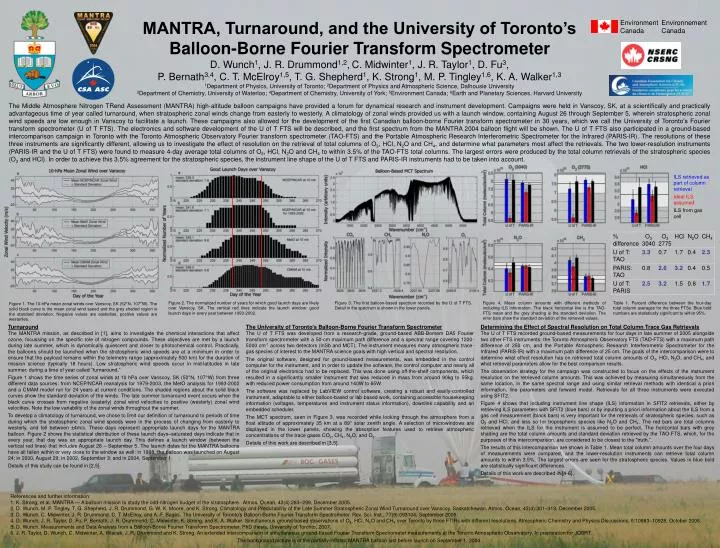
Environment Canada Environnement Canada MANTRA, Turnaround, and the University of Toronto’s Balloon-Borne Fourier Transform Spectrometer D. Wunch1, J. R. Drummond1,2,C. Midwinter1, J. R. Taylor1, D. Fu3, P. Bernath3,4, C. T. McElroy1,5, T. G. Shepherd1, K. Strong1, M. P. Tingley1,6, K. A. Walker1,3 1Department of Physics, University of Toronto; 2Department of Physics and Atmospheric Science, Dalhousie University 3Department of Chemistry, University of Waterloo; 4Department of Chemistry, University of York; 5Environment Canada; 6Earth and Planetary Sciences, Harvard University The Middle Atmosphere Nitrogen TRend Assessment (MANTRA) high-altitude balloon campaigns have provided a forum for dynamical research and instrument development. Campaigns were held in Vanscoy, SK, at a scientifically and practically advantageous time of year called turnaround, when stratospheric zonal winds change from easterly to westerly. A climatology of zonal winds provided us with a launch window, containing August 26 through September 5, wherein stratospheric zonal wind speeds are low enough in Vanscoy to facilitate a launch. These campaigns also allowed for the development of the first Canadian balloon-borne Fourier transform spectrometer in 30 years, which we call the University of Toronto’s Fourier transform spectrometer (U of T FTS). The electronics and software development of the U of T FTS will be described, and the first spectrum from the MANTRA 2004 balloon flight will be shown. The U of T FTS also participated in a ground-based intercomparison campaign in Toronto with the Toronto Atmospheric Observatory Fourier transform spectrometer (TAO-FTS) and the Portable Atmospheric Research Interferometric Spectrometer for the Infrared (PARIS-IR). The resolutions of these three instruments are significantly different, allowing us to investigate the effect of resolution on the retrieval of total columns of O3, HCl, N2O and CH4, and determine what parameters most affect the retrievals. The two lower-resolution instruments (PARIS-IR and the U of T FTS) were found to measure 4-day average total columns of O3, HCl, N2O and CH4 to within 3.5% of the TAO-FTS total columns. The largest errors were produced by the total column retrievals of the stratospheric species (O3 and HCl). In order to achieve this 3.5% agreement for the stratospheric species, the instrument line shape of the U of T FTS and PARIS-IR instruments had to be taken into account. ILS retrieved as part of column retrieval Ideal ILS assumed ILS from gas cell Figure 1. The 10-hPa mean zonal winds over Vanscoy, SK (52°N, 107°W). The solid black curve is the mean zonal wind speed and the grey shaded region is the standard deviation. Negative values are easterlies, positive values are westerlies. Figure 2. The normalized number of years for which good launch days are likely over Vanscoy, SK. The vertical red lines indicate the launch window: good launch days in every year between 1993-2002. Figure 3. The first balloon-based spectrum recorded by the U of T FTS. Detail in the spectrum is shown in the lower panels. Figure 4. Mean column amounts with different methods of including ILS information. The black horizontal line is the TAO-FTS mean and the grey shading is the standard deviation. The error bars show the standard deviation of the retrieved values. Table 1. Percent difference between the four-day total column averages for the three FTSs. Blue bold numbers are statistically significant to within 95%. The University of Toronto’s Balloon-Borne Fourier Transform Spectrometer The U of T FTS was developed from a research-grade, ground-based ABB-Bomem DA5 Fourier transform spectrometer with a 50-cm maximum path difference and a spectral range covering 1200-5000 cm-1 across two detectors (InSb and MCT). The instrument measures many atmospheric trace-gas species of interest to the MANTRA science goals with high vertical and spectral resolution. The original software, designed for ground-based measurements, was embedded in the control computer for the instrument, and in order to update the software, the control computer and nearly all of the original electronics had to be replaced. This was done using off-the-shelf components, which resulted in a significantly smaller instrument that was reduced in mass from around 90kg to 55kg, with reduced power consumption from around 140W to 65W. The software was replaced by LabVIEW control software, creating a robust and easily-controlled instrument, adaptable to either balloon-based or lab-based work, containing accessible housekeeping information (voltages, temperatures and instrument status information), downlink capability and an embedded scheduler. The MCT spectrum, seen in Figure 3, was recorded while looking through the atmosphere from a float altitude of approximately 35 km at a 89° solar zenith angle. A selection of microwindows are displayed in the lower panels, showing the absorption features used to retrieve atmospheric concentrations of the trace gases CO2, CH4, N2O, and O3. Details of this work are described in [3,5]. Determining the Effect of Spectral Resolution on Total Column Trace Gas Retrievals The U of T FTS recorded ground-based measurements for four days in late summer of 2005 alongside two other FTS instruments: the Toronto Atmospheric Observatory FTS (TAO-FTS) with a maximum path difference of 250 cm, and the Portable Atmospheric Research Interferometric Spectrometer for the Infrared (PARIS-IR) with a maximum path difference of 25 cm. The goals of the intercomparison were to determine what effect resolution has on retrieved total column amounts of O3, HCl, N2O, and CH4, and what retrieval parameters allow for the best comparison results. The observation strategy for the campaign was constructed to focus on the effects of the instrument resolution on the retrieved column amounts. This was achieved by measuring simultaneously from the same location, in the same spectral range and using similar retrieval methods with identical a priori information, line parameters and forward model. Retrievals for all three instruments were executed using SFIT2. Figure 4 shows that including instrument line shape (ILS) information in SFIT2 retrievals, either by retrieving ILS parameters with SFIT2 (blue bars) or by inputting a priori information about the ILS from a gas cell measurement (black bars) is very important for the retrievals of stratospheric species, such as O3 and HCl, and less so for tropospheric species like N2O and CH4. The red bars are total columns retrieved when the ILS for the instrument is assumed to be perfect. The horizontal bars with grey shading are the total column amounts and standard deviation retrieved by the TAO-FTS, which, for the purposes of this intercomparison, are considered to be closest to the “truth.” The results of this intercomparison are shown in Table 1. Mean total column amounts over the four days of measurements were compared, and the lower-resolution instruments can retrieve total column amounts to within 3.5%. The largest errors are seen for the stratospheric species. Values in blue bold are statistically significant differences. Details of this work are described in [4-6]. Turnaround The MANTRA mission, as described in [1], aims to investigate the chemical interactions that affect ozone, focussing on the specific role of nitrogen compounds. These objectives are met by a launch during late summer, which is dynamically quiescent and closer to photochemical control. Practically, the balloons should be launched when the stratospheric wind speeds are at a minimum in order to ensure that the payload remains within the telemetry range (approximately 500 km) for the duration of mission science (typically 18 hours). Low stratospheric wind speeds occur in mid-latitudes in late summer, during a time of year called “turnaround.” Figure 1 shows the time series of zonal winds at 10 hPa over Vanscoy, SK (52°N, 107°W) from three different data sources: from NCEP/NCAR reanalysis for 1979-2003, the MetO analysis for 1993-2002 and a CMAM model run for 24 years at current conditions. The shaded regions about the solid black curves show the standard deviation of the winds. The late summer turnaround event occurs when the black curve crosses from negative (easterly) zonal wind velocities to positive (westerly) zonal wind velocities. Note the low variability of the zonal winds throughout the summer. To develop a climatology of turnaround, we chose to limit our definition of turnaround to periods of time during which the stratospheric zonal wind speeds were in the process of changing from easterly to westerly, and fell between ±4m/s. These days represent appropriate launch days for the MANTRA balloon. Figure 2 shows the statistical distribution of these launch days–saturated days indicate that in every year, that day was an appropriate launch day. This defines a launch window (between the vertical red lines) that includes August 26 – September 5. The launch dates for the MANTRA balloons have all fallen within or very close to the window as well: in 1998, the balloon was launched on August 24; in 2000, August 29; in 2002, September 3; and in 2004, September 1. Details of this study can be found in [2,5]. • References and further information: • K. Strong, et al. MANTRA — A balloon mission to study the odd-nitrogen budget of the stratosphere. Atmos. Ocean, 43(4):283–299, December 2005. • D. Wunch, M. P. Tingley, T. G. Shepherd, J. R. Drummond, G. W. K. Moore, and K. Strong. Climatology and Predictability of the Late Summer Stratospheric Zonal Wind Turnaround over Vanscoy, Saskatchewan. Atmos. Ocean, 43(4):301–313, December 2005. • D. Wunch, C. Midwinter, J. R. Drummond, C. T. McElroy, and A.-F. Bagès. The University of Toronto’s Balloon-Borne Fourier Transform Spectrometer. Rev. Sci. Inst., 77(9):093104, September 2006. • D. Wunch, J. R. Taylor, D. Fu, P. Bernath, J. R. Drummond, C. Midwinter, K. Strong, and K. A. Walker. Simultaneous ground-based observations of O3, HCl, N2O and CH4 over Toronto by three FTIRs with different resolutions. Atmospheric Chemistry and Physics Discussions, 6:10883–10928, October 2006. • D. Wunch. Measurements and Data Analysis from a Balloon-Borne Fourier Transform Spectrometer. PhD thesis, University of Toronto, 2007. • J. R. Taylor, D. Wunch, C. Midwinter, A. Wiacek, J. R. Drummond and K. Strong. An extended intercomparison of simultaneous ground-based Fourier Transform Spectrometer measurements at the Toronto Atmospheric Observatory. In preparation for JQSRT. • The background picture is of the partially-inflated MANTRA balloon just before launch on September 1, 2004.