Download
1 / 11

E N D
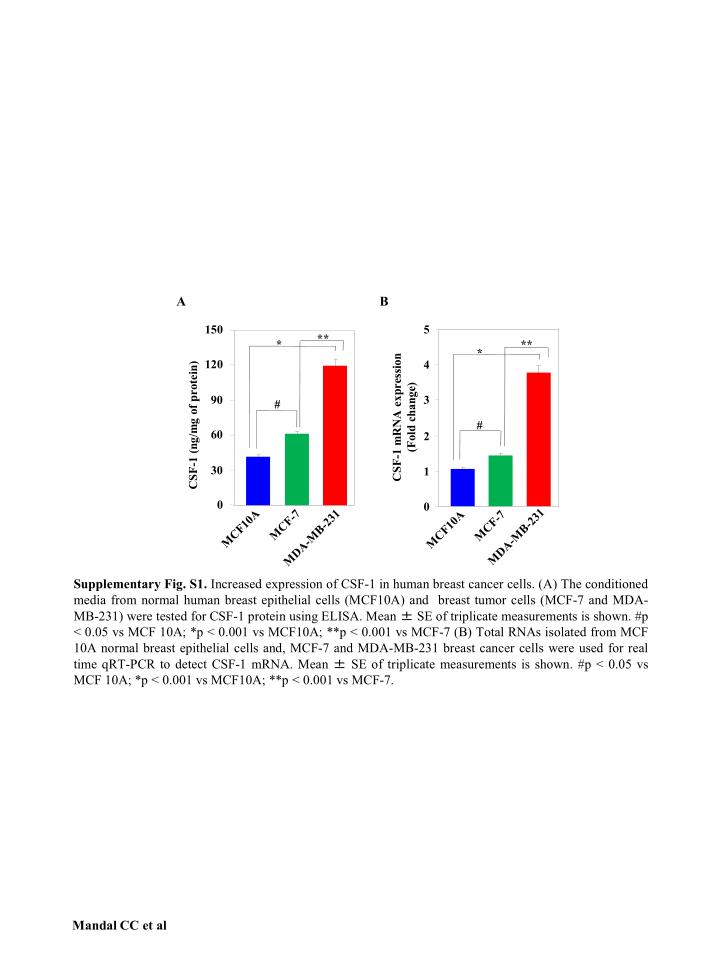
A B Supplementary Fig. S1. Increased expression of CSF-1 in human breast cancer cells. (A) The conditioned media from normal human breast epithelial cells (MCF10A) and breast tumor cells (MCF-7 and MDA-MB-231) were tested for CSF-1 protein using ELISA. Mean ± SE of triplicate measurements is shown. #p < 0.05 vs MCF 10A; *p < 0.001 vs MCF10A; **p < 0.001 vs MCF-7 (B) Total RNAs isolated from MCF 10A normal breast epithelial cells and, MCF-7 and MDA-MB-231 breast cancer cells were used for real time qRT-PCR to detect CSF-1 mRNA. Mean ± SE of triplicate measurements is shown. #p < 0.05 vs MCF 10A; *p < 0.001 vs MCF10A; **p < 0.001 vs MCF-7. ** * ** * # CSF-1 mRNA expression (Fold change) CSF-1 (ng/mg of protein) # 150 5 120 4 MCF-7 MCF-7 90 MCF10A MCF10A 3 MDA-MB-231 MDA-MB-231 60 2 30 1 0 0 Mandal CC et al
A B Supplementary Fig. S2. DHA has no effect on CSF-1 expression in MCF10A normal breast epithelial cells. MCF10A cells were incubated with 152nM DHA. (A) The conditioned media were tested for CSF-1 protein using ELISA. Mean ± SE of triplicate measurements is shown. (B) Total RNAs were used for real time qRT-PCR to detect CSF-1 mRNA. Mean ± SE of triplicate measurements is shown. 40 30 20 10 0 1.2 CSF-1 mRNA expression (Fold change) CSF-1 (ng/mg of protein) 1.0 0.8 0.6 0.4 DHA - + DHA - + 0.2 0 Mandal CC et al
A B C * * CSF-1 (ng/mg of protein) CSF-1 (ng/mg of protein) * CSF-1 (ng/mg of protein) PTEN - + Δp85 - + Akt K179M - + Vector + - Vector + - Vector + - HA-Δp85 HA-Akt K179M HA-PTEN 1 2 1 2 1 2 Actin Actin Actin D E F CSF-1 mRNA expression (Fold change) CSF-1 mRNA expression (Fold change) CSF-1 mRNA expression (Fold change) * * * Δp85 - + Akt K179M - + PTEN - + Vector + - Vector + - Vector + - HA-Δp85 HA-Akt K179M HA-PTEN 1 2 1 2 1 2 Actin Actin Actin Supplementary Fig. S3. PTEN regulates expression of CSF-1 via PI 3 kinase/Akt signaling in MCF-7 breast cancer cells. (A and D) MCF-7 cells were transfected with vector alone or HA-tagged PTEN plasmids. The conditioned media from vector and PTEN-trasnfected cells were used for ELISA to detect CSF-1 protein (panel A). Mean ± SE of triplicate measurements is shown *p = 0.0195 vs vector. Total RNAs from these cells were examined for CSF-1 mRNA by qRT-PCR as described in the Materials and Methods. (panel D). Mean ± SE of triplicate measurements is shown *p = 0.008 vs vector. (B, C, E and F) MCF-7 breast cancer cells were transfected with vector or dominant negative PI 3 kinase (HA-tagged Dp85; panels B and E) or dominant negative Akt (HA-tagged K179M; panels C and F). The conditioned media were used for ELISA to detect CSF-1 protein (panels B and C). Mean ± SE of triplicate measurements is shown. *p = 0. 0126 and 0.0078 vs. vector, respectively. Total RNAs from these cells were examined for CSF-1 mRNA by qRT-PCR (panels E and F). Mean ± SE of triplicate measurements is shown. *p = 0. 0378 and 0.0166 vs. vector, respectively. Bottom panels show expression of HA-tagged proteins. 50 40 30 1.2 1.0 20 0.8 0.6 10 0.4 0.2 0 0 1.2 50 1.0 40 0.8 0.6 30 0.4 0.2 20 0 10 1.2 1.0 0 0.8 0.6 0.4 50 0.2 0 40 30 20 10 0 Mandal CC et al
60 50 40 30 20 10 A B C 0 50 40 50 Relative Luciferase Activity (Arbitrary unit) Relative Luciferase Activity (Arbitrary unit) Relative Luciferase Activity (Arbitrary unit) 40 30 * 30 * 20 * 20 10 10 0 0 Akt K179M - + Δp85 - + PTEN - + Vector + - Vector + - Vector + - HA-Akt K179M HA-PTEN HA-Δp85 1 2 1 2 1 2 Actin Actin Actin Supplementary Fig. S4. PTEN regulates CSF-1 transcription via PI 3 kinase/Akt signaling in MCF-7 breast cancer cells. MCF-7 cells were transfected with CSF-1-Luc reporter and either PTEN (panel A) , p85 (panel B) or Akt K179M (panel C). The cell lysates were assayed for luciferase activity as described in the Materials and Methods. Mean±SE for triplicate measurements is shown. *p = 0.0186 (panel A), 0.0157 (panel B) and 0.0023 (panel C) vs. control. Bottom panels show expressions for HA tagged PTEN, p85 and Akt K179M, in panels A, B and C, respectively. Mandal CC et al
A B CMV miR-21 - + Vector + - PTEN 1 2 Actin 3.5 CMV miR-21 3.0 2.5 miR-21/U6 (Fold expression) 2.0 1.5 1.0 miR-21/U6 (Fold expression) 0.5 0 Supplementary Fig. S5. miR-21 targets the 3’UTR of PTEN mRNA. (A) MDA-MB-231 breast cancer cells were cotransfected with a reporter plasmid containing the 3’UTR of PTEN downstream of luciferase gene (PTEN 3’-UTR-Luc) along with either vector or CMV-miR-21 expression plasmid. The cell lysates were assayed for luciferase activity as described in the Materials and Methods section of the text. Mean ± SE of triplicate measurements is shown. *p = 0.033 vs. control. (B) MDA-MB-231 breast tumor cells were transfected with CMV-miR-21. The cell lysates were used for immunoblotting with PTEN and actin antibodies respectively. RNAs were isolated from parallel dishes. Bottom parts in both panels show expression of mature miR-21 in the transfected cells. Mandal CC et al 500 400 300 200 100 Relative Luciferase Activity (Arbitrary unit) * 0 - + Vector + - 3.5 3.0 2.5 2.0 1.5 1.0 0.5 0
A C D miR-21 Sponge - + * Vector + - Relative Luciferase Activity (Arbitrary unit) PTEN 1 2 Actin miR-21 Sponge - + GFP 1 2 Vector + - GAPDH GFP 1 2 GAPDH GFP Poly A CMV B 1200 A A G C 900 miR-21 3’- A G U U G U A G U C U A U U C G A U -5’ miR-21/U6 (Fold expression) 5’- -3’ Sponge U C A A C A U C A G A U A A G C U A G A C 600 1.25 300 miR-21 Sponge - + 1.00 Vector + - 0.75 0 GFP 0.50 1 2 0.25 GAPDH 0 Supplementary Fig. S6. (A) Structure of the miR-21 Sponge expression plasmid. The anti-miR-21 sequence with one bulge and complementary region in the PTEN 3’UTR are shown at the top. Seven tandem copies of this sequence are present downstream of GFP cDNA under the control of CMV promoter. (B) MDA-MB-231 cells were transfected with the miR-21 Sponge or vector alone. Total RNAs were used in RT-PCR to detect mature miR-21 and GFP mRNA. Expression of GAPDH was used as a loading control. Expression of GFP acts as a surrogate for miR-21 Sponge expression. (C) MDA-MB-231 cells were transfected with PTEN 3’-UTR-Luc plasmid along with vector or miR-21 Sponge. Lysates were analyzed for luciferase activity 48h post transfection. Bottom panel shows GFP and GAPDH mRNA expressions using total RNA isolated from parallel transfected dishes. Mean ± SE of triplicate measurements is shown. *p = 0.01 vs. vector control. (D) MDA-MB-231 cells were transfected with vector or miR-21 sponge plasmids. Cell lysates were immunoblotted with PTEN or actin antibodies. RNA isolated from parallel dishes were analyzed for GFP and GAPDH expressions by RTPCR (bottom panels). Mandal CC et al
A B C D 4.0 3.5 3.0 2.5 2.0 1.5 1.0 0.5 0 H E F G CMV miR-21 Supplementary Fig. S7. Expression of miR-21 in the CMV-miR-21-transfected MDA-MB-231 cells (panels A, C, E and G) and MCF-7 cells (panels B, D , F and H) for the results presented in Fig. 5. MDA-MB-231 or MCF-7 cells were transfected with CMV miR-21 or vector alone along with the indicate plasmids as described in the Fig. 5 legend. Total RNAs from these cells were used to detect mature miR-21 and U6 RNA by real time qRT-PCR as described in the Materials and Methods of the text. 5.0 5.0 4.0 4.5 4.5 miR-21/U6 (Fold expression) miR-21/U6 (Fold expression) miR-21/U6 (Fold expression) 3.5 5.0 5.0 3.0 4.0 4.0 2.5 4.5 4.5 miR-21/U6 (Fold expression) 3.5 3.5 2.0 4.0 4.0 3.0 3.0 1.5 3.5 3.5 - + + CMV miR-21 1.0 CMV miR-21 - + + CMV miR-21 - + + CMV miR-21 - + + 2.5 2.5 + - - Vector 3.0 3.0 Vector + - - Vector + - - Vector + - - 0.5 2.0 2.0 PTEN - - + PTEN - - + Akt K179M - - + Akt K179M - - + 0 2.5 2.5 1.5 1.5 2.0 2.0 1.0 1.0 1.5 1.5 0.5 0.5 1.0 1.0 0 0 0.5 0.5 4.5 5.0 4.5 4.0 0 0 miR-21/U6 (Fold expression) miR-21/U6 (Fold expression) miR-21/U6 (Fold expression) miR-21/U6 (Fold expression) 4.0 3.5 3.5 3.0 3.0 2.5 2.5 2.0 2.0 1.5 1.5 1.0 1.0 - + + - + + - + + CMV miR-21 - + + CMV miR-21 CMV miR-21 0.5 0.5 Vector + - - + - - + - - Vector + - - Vector Vector 0 0 PTEN - - + PTEN - - + Akt K179M - - + Akt K179M - - + Mandal CC et al
A B C D E F G H Supplementary Fig. S8. Expression of miR-21 in the CMV-miR-21-transfected MDA-MB-231 (panels A, C E and G) and MCF-7 (panels B, D, F and H) cells for the results presented in Fig. 6. MDA-MB-231 and MCF-7 cells were transfected with CMV miR-21 or vector alone followed by incubation with DHA as described in the Fig. 6 legend. Total RNAs from these cells were used to detect mature miR-21 and U6 RNA by real time qRT-PCR as described in the Materials and Methods of the text. 3.0 2.5 2.5 3.0 2.0 2.0 miR-21/U6 (Fold expression) miR-21/U6 (Fold expression) miR-21/U6 (Fold expression) 1.75 1.5 2.5 miR-21/U6 (Fold expression) 1.5 1.0 1.5 1.25 2.0 0.5 1.0 1.0 0.75 0 1.5 DHA - + + DHA - + + DHA - + + DHA - + + 0.5 0.5 Vector + + - Vector + + - Vector + + - Vector + + - 0.25 1.0 CMV miR-21 - - + CMV miR-21 - - + CMV miR-21 - - + CMV miR-21 - - + 0 0 0.5 0 2.0 1.5 1.25 miR-21/U6 (Fold expression) miR-21/U6 (Fold expression) miR-21/U6 (Fold expression) miR-21/U6 (Fold expression) 1.5 1.0 1.0 0.75 0.5 3.0 4.0 0.5 0.25 DHA - + + DHA - + + DHA - + + DHA - + + 3.5 2.5 Vector + + - Vector + + - Vector + + - Vector + + - 0 0 CMV miR-21 - - + CMV miR-21 - - + CMV miR-21 - - + CMV miR-21 - - + 3.0 2.0 2.5 1.5 2.0 1.5 1.0 1.0 0.5 0.5 0 0 Mandal CC et al
Volume of Tumor (mm3) * Supplementary Fig. S9. Fish oil reduces tumor volume in mice. Nude mice fed either fish oil diet (+) or lab chow (-) were injected with MDA-MB-231 breast tumor cells as described in the materials and methods of the text. The tumor volume of the left mammary gland is shown. Mean ± SE of 5 animals is shown. *p = 0.003 vs control diet fed animals. Fish Oil - + 4000 3500 3000 2500 2000 1500 1000 500 0 Mandal CC et al
Supplementary Fig. S10. DHA does not have any effect on miR-21 expression in MCF10A normal breast epithelial cells. MCF10A cells were incubated with 152nMDHA for 24 hours. The total RNAs were tested for miR-21 and U6 expression by qRT-PCR as described in the Materials and Methods. 1.2 1.0 0.8 0.6 0.4 0.2 miR-21/U6 (Fold expression) 0 DHA - + Mandal CC et al
Supplementary Fig. S11. Effect of DHA on estrogen receptor expression in MCF-7 human breast cancer cells. MCF-7 cells were incubated with DHA for 24 hours. Cleared cell lysates were immunoblotted with ER and actin antibodies as indicated. DHA - + ER alpha 1 2 Actin Mandal CC et al