Download
1 / 15
150 likes | 282 Views
Lesson 10.1a 2-proportion z-interval. Comparing Two Proportions. Comparisons between two percentages are much more common (and interesting) than questions about isolated percentages.

E N D
Lesson 10.1a 2-proportion z-interval
Comparing Two Proportions • Comparisons between two percentages are much more common (and interesting) than questions about isolated percentages. • Why? We often want to know how two groups differ, whether a treatment is better than a placebo control, or whether this year’s results are better than last year’s.
Example Suppose you are interested in whether men and women differ with regard to how often they wash their hands in public restrooms?
Another Standard Deviation… • In order to examine the difference between two proportions, we need another standard deviation formula… • Recall that standard deviations don’t add, but variances do… so long as we have two independent random variables.
Example from Chapter 6 Two empty fields are used as parking lots for concerts and festivals. The number of vehicles that can park in Lot A has a mean of 219 and standard deviation of 13. Lot B can hold an average of 193 cars with a standard deviation of 11. a. What is the expected difference for the number of vehicles parked in the two lots. b. Find the standard deviation of that difference.
The Standard Deviation of the Difference Between Two Proportions • Proportions observed in independent random samples are independent. Thus, we can add their variances. So… • The standard deviation (really “standard error”) of the difference between two sample proportions is
Assumptions and Conditions We will just combine the first two to be either… • 2 independent SRS • or • RAT (2 independent groups) • SRS (or RAT):EACH sample is a SRS from its’ own population (or 2 experimental groups randomly assigned to treatments) • Independent Samples: The two groups we’re comparing must be independent of each other. (ie, drawn independently) • 10% Condition:n1 and n2 are both <10% of their respective populations (*only need to check if sampling w/o replacement… do not check for RAT) • Sample Size Condition: Both groups are big enough that at least 5 successes and 5 failures have been observed in each.
The Sampling Distribution • We already know that for large enough samples, each of our proportions has an approximately Normal sampling distribution. • The same is true of their difference.
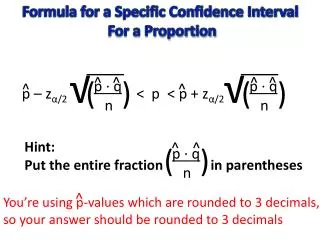
Two-Proportion z-Interval • When the conditions are met, we are ready to find the confidence interval for the difference of two proportions: • The confidence interval is Statistic ± (critical value) (standard dev of statistic)
Conclusion Statement Or you can just “steal” wording from the question We are ___% confident that the actual proportion of [p1 in context] is between ___% and ___% [more/less] than the proportion of [p2 in context].
Back to the example… Suppose you are interested in whether men and women differ with regard to how often they wash their hands in public restrooms? Researchers monitored the behavior of public restroom users at major venues such as Turner Field and Grand Central Station and found that 2393 out of 3206 men washed their hands and 2802 of 3130 women washed their hands. Create a 95% confidence interval to describe the difference.
We are 95% confident that the actual proportion of women who wash their hands in public rest- rooms is between 13.03% and 16.73% more than the proportion of men who do the same. Pmactual proportion of men who wash their hands in public restroomsPwactual proportion of women who wash their hands in public rr Confidence interval??? It’s still P. A. N. I. C. Define the Parameters … both of them * Assume 2 independent SRS 2-proportion z-interval * 3206 < 10% of all men who use public rr 3130 < 10% of all women who use public rr All are > 5 C =.95 z*=1.96
Example At Community Hospital, the burn center is experimenting with a new plasma compress treatment. In the study, 316 patients with minor burns were assigned to receive the plasma compress treatment. Of these patients, it was found that 259 had no visible scars after treatment. Another group of 419 patients with minor burns received no plasma compress treatment. For this group, it was found that 94 had no visible scars after treatment. Construct a 95% confidence interval for the difference in proportion of people who had no visible scars between the plasma compress treatment and control group.
pT: proportion of ppl who received plas comp treatment that had no visible scars pN: proportion of ppl who did NOT receive plas comp treat that had no visible scars • RAT (randomly assigned treatments) – 2 independent groups • nTpT=259, nTqT=57, nNpN=94, nNqN=325 -> all >5 • (all the p’s and q’s should have hats) 2-Proportion Z-Interval We are 95% confident that the actual proportion of people who received plasma compress treatment that had no visible scars was between 53.7% and 65.4% more that the proportion of those who didn’t receive the treatment.
Ch22 (page 433) #6 • In 1995, 24.8% of 550 white adults surveyed reported that they smoke cigarettes, while 25.7% of the 550 black adults surveyed were smokers. • Create a 90% confidence interval for the difference in percentages of smokers among black and white American adults. • Does this survey indicate a race-based difference in smoking among American adults?