Download
1 / 19
210 likes | 339 Views
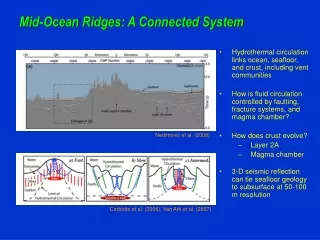
Mid-ocean Geostrophic Turbulence. prototype: two-dimensional turbulence. Continuously stratified case. Energy transfer is to low. WKB form. Energy transfer is to low. Energy transfer is toward the equator and into high vertical mode.

E N D
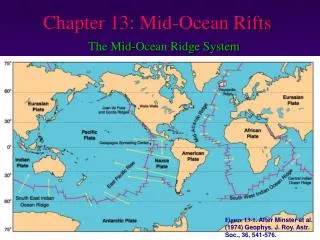
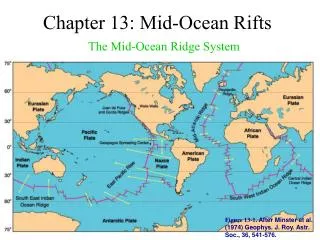
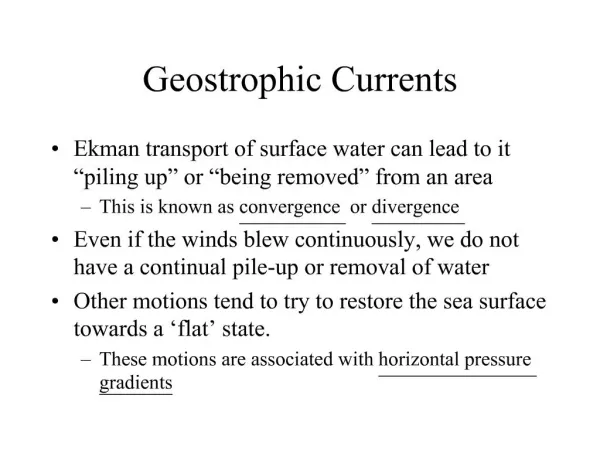
Mid-ocean Geostrophic Turbulence prototype: two-dimensional turbulence
Continuously stratified case Energy transfer is to low
WKB form Energy transfer is to low Energy transfer is toward the equator and into high vertical mode. The energy in mode n shows an equatorial peak of width W, determined by i.e.
“Global characteristics of ocean variability estimated from regional TOPEX/POSEIDON altimeter measurements” D. Stammer, J. Phys. Oc. 1997 Eddy kinetic energy at the sea surface (cm/sec)**2
U. Send, C. Eden & F. Schott “Atlantic equatorial deep jets…” J. Phys. Oc. 2002 Zonal flow (cm/sec) along the equator from six cruises.
Six-layer QG model kinetic energy in modes 0 to 5 as a function of y 1982
Six-layer QG model mode: 0 3 5
Two-layer QG flow 3 quadratic invariants: energy & potential enstrophy of each layer This is not wrong, but it is incomplete. Not all the information is being used. To see what phenomena are being missed, consider cases with a very high degree of asymmetry between the layers.
Two-layer flow with the lower layer at rest Work of Jurgen Theiss (“Rhines latitude”) Problem with this model: the lower layer does not remain at rest.
Two-layer QG flow top bottom 2 sources of asymmetry:
Guidance from equilibrium stat-mech (equipartition theory) 1976
But beta doesn’t actually vanish…… or does it? 2-layer QG with a zonal mean flow Baroclinic instability requires opposite signs. Therefore the threshold for instability is:
The two cases of neutral stability initial stream function 1000 sq km = 512 x 512, rdef = 40 km, depth ratio=10 tropical extra-tropical urms = 10 km/day upper layer lower layer
Stream function at 100 days tropical extra-tropical Rhines scale = 88 km 27 km upper 7.20 k/d 4.02 k/d lower 0.51 k/d 8.47 k/d
Potential vorticity at 100 days tropical extratropical upper lower
Second experiment: lower layer initially at rest Stream function at 150 days tropical extra-tropical Rhines scale = 77 km 25 km upper 6.52 k/d 6.42 k/d lower 0.49 k/d 1.18 k/d
Potential vorticity at 150 days tropical extratropical upper lower