Download
1 / 18
180 likes | 315 Views
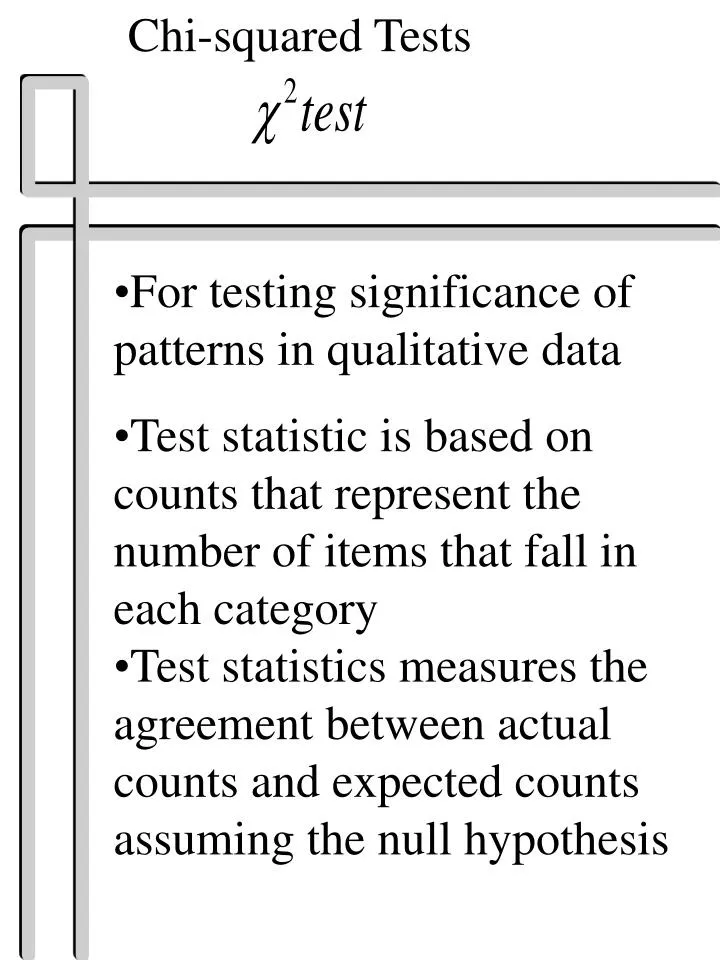
Chi-squared Tests. For testing significance of patterns in qualitative data Test statistic is based on counts that represent the number of items that fall in each category Test statistics measures the agreement between actual counts and expected counts assuming the null hypothesis.

E N D
Chi-squared Tests • For testing significance of patterns in qualitative data • Test statistic is based on counts that represent the number of items that fall in each category • Test statistics measures the agreement between actual counts and expected counts assuming the null hypothesis
Chi-squared Distribution The chi-square distribution can be used to see whether or not an observed counts agree with an expected counts.Let O = observed count and E = Expected count
Testing if Observed Counts are in Agreement with Known Percentages Consider items of a population distributed over k categories in in proportions If H0 is true then we expect Ei = n , expected frequency for the ith category as opposed to Oi, observed frequency.
An Example Biased Coin? Observed Expected Frequency Frequency H 40 50 T 60 50 sum 100 100
degrees of freedom = (R –1)(C – 1) R = number of rows C = number of columns
Is our chi square value an extreme outcome just by chance while in fact the null hypothesis is true and sample frequencies are not significantly apart from the ideal frequencies? Note that chi-squared statistic is a positive number
only the right-hand sideof the table is used • nondirectional test • the statistic has no sign
Observed Expected Die Frequency Frequency 1 4 10 2 6 10 3 17 10 4 16 10 5 8 10 6 9 10 sum 60 60
degrees of freedom = number of terms -1
2 x 2 contingency tables Chi-squared test for independence Var B total b1 b2 Var A a1 a2 total Ho : The two variable are independent Ha : The two variables are associated
Result notdef. total def Operator A 100 900 1000 B 60 440 500 total 160 1340 1500
Result notdef. total def Operator A 100 900 1000 B 60 440 500 total 160 1340 1500 Total number of items=1500 Total number of defective items=160 Overall defective rate =160/1500=0.1067 Now, apply this rate to the number of items produced by each operator.
Result notdef. total def Operator A 100 900 1000 B 60 440 500 total 160 1340 1500 Expected defective from Operator A = 1000 * 0.1067 = 106.7 (expected not defective=1000-106.7=893.3) Expected defective from Operator B = 500 * 0.1067 = 53.3 (expected not defective=500-53.3=446.7)
notdef. total def Operator 1000 A 100 900 B 60 440 500 total 160 1340 1500 Expected notdef. total def Operator A 106.7 893.3 B 53.3 446.7 total Result
r x c contingency tables SA A NO D SD Gr 1 12 18 4 8 12 Gr2 48 22 10 8 10 Gr3 10 4 12 10 12
use when you have categorical data • measure the difference between actual counts and expected counts • test the independence of two variables • Assumptions:data set is a random sampleyou have at least 5 counts in each category • degrees of freedom =(categories var1 -1)(categories var2 -1)