Download
1 / 13
130 likes | 131 Views
This presentation discusses the development of performance metrics for highway safety in a connected vehicle environment, utilizing near-crash events from the SHR2P Naturalistic Driving Study. The methodology, data sources, preliminary results, and next steps are outlined.

E N D
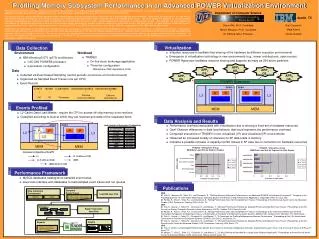
Developing Highway Safety Performance Metrics in an Advanced Connected Vehicle Environment Utilizing Near-Crash Events from the SHRP2 Naturalistic Driving Study Kevin Majka & Alan Blatt, CUBRC First Annual TransInfo Symposium August13, 2015 Buffalo, NY
Outline of Presentation Introduction and Motivation Methodology Data Sources Preliminary Results Next Steps Summary
Introduction to CUBRC • CUBRC is an independent scientific not-for-profit corporation established in 1983 with core competencies in: • Aeronautics • Chemical, Biological, and Medical Sciences • Information Exploitation • Public Safety & Transportation • $45M in sales, 130 employees (1/3 of which have advanced degrees) in 2014 • CUBRC has a history of successful collaborations with private companies, public agencies, and academia (SUNY at Buffalo). Dayton, OH Buffalo, NY Rome, NY D.C. Area Palmdale, CA Roswell, NM San Antonio, TX
Motivation • • This research represents work in progress • MAP-21 requires a greater emphasis on developing performance measures to justify roadway safety improvements • • Advanced Driver Assistance Systems, Infrastructure Based Technologies, and Active Traffic Management have the potential to greatly reduce the number and severity of crashes • • This project proposes an alternative highway safety performance measure through the monitoring and classification of near crash events Collaborators
Methodology • Near crash events are normally defined as the exceedance of accepted thresholds for various vehicle kinematics such as lateral/longitudinal acceleration/deceleration, forward or rear time to collision, and yaw rates • Kinematics data from the SHRP2 Naturalistic Driving Study can be used as a surrogate of CV measures and as a way to identify new metrics and demonstrate their value • Near Crash events can be compared to the number of fatal, serious, and property damage only crashes and rates
Preliminary Results NYS SMS Data for 2013: (K) Fatal 54 (A) Incapacitating Injury 632 (B) Non Incapacitating Inj. 1,116 (C) Possible Injury 5,577 (O) Property Damage Only 14,883 VMT (millions) 5,036 Crash Rates per 100 million VMT (K) Fatal 1.07 (A) Incapacitating Injury 12.55 (B) Non Incapacitating Inj. 22.16 (C) Possible Injury 110.74 (O) Property Damage Only 295.53 Crash Severity Distribution: Erie County, NY, 2013
Preliminary Results (Cont') • SHRP2 NDS Data (Total) • Data Collection Sites 6 • Drivers 3,247 • Vehicles 3,362 • Trips 5,414,063 • Vehicle Miles Travelled 49,700,000 • Total Data 4 Petabytes • SHRP2 NDS Data (NY: InSight) • Drivers 772 • Vehicles 784 • Trips 1,312,668 • Vehicle Miles Travelled 8,006,145 Head Unit Rear Looking Camera Radar Unit OBD Connector DAS Main Unit Antennas
Preliminary Results (Cont') SHRP2 NDS Data (NY: S06/InSight) (I) Most Severe 15/22 (II) Police-reportable Crash 27/46 (III) Minor Crash 36/121 (IV) Low-risk Tire Strike 57/111 VMT (millions) 8.01 Rate per 100 million VMT (NY: S06/InSight) Most Severe 187/275 (II) Police-Reportable Crash 337/575 (III) Minor Crash 450/1,512 (IV) Low-Risk Tire Strike 712/1,387 I - Most Severe Crash Any crash that includes an airbag deployment; any injury; a vehicle roll over; a high Delta V; or that requires vehicle towing. II - Police-Reportable Crash Includes sufficient property damage that it is police reportable (minimum of ~$1500 worth of damage, as estimated from video). III - Minor Crash Physical Contact with Another Object. Includes most road departures IV - Low-Risk Tire Strike Tire strike only with little/no risk element
Next Steps • Rectify crash numbers on InSight vs. SHRP2 S06 final report • Verify the exposure rates for SHRP2 fleet • Develop a mapping of kinematics to near crash & crash events to provide a correlation coefficient and provide reliable metrics • Better define the relationship between near crashes and less studied factors such as ABS and Traction Control activations • Expand analysis to other SHRP2 NDS test sites
Summary • Data from SHRP2 NDS allows for the characterization of drivers while data from a CV environment could provide numerous more events for analysis • In 2015 NHTSA will require that all new vehicles contain event data recorders to store vehicle kinematic data • Near crash events can provide meaningful safety performance metrics and will be more widely available in the future • The anticipated results of this project will provide transportation safety analysts with insights into the frequency of near crash events, pre-near crash contributing factors, and the types of evasive crash maneuvers