Download
1 / 10
190 likes | 524 Views
Total Internal Reflectance Fluorescence Microscopy- TIRFM.

E N D
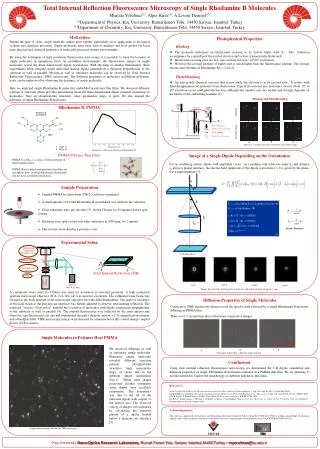
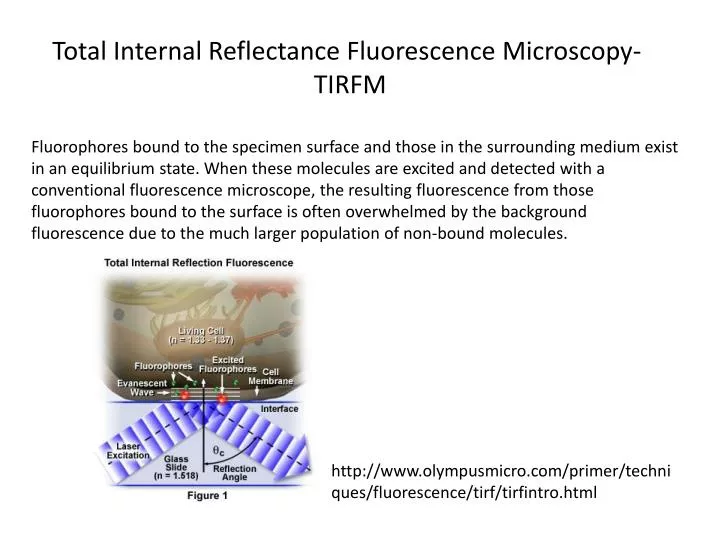
Total Internal Reflectance Fluorescence Microscopy- TIRFM Fluorophores bound to the specimen surface and those in the surrounding medium exist in an equilibrium state. When these molecules are excited and detected with a conventional fluorescence microscope, the resulting fluorescence from those fluorophores bound to the surface is often overwhelmed by the background fluorescence due to the much larger population of non-bound molecules. http://www.olympusmicro.com/primer/techniques/fluorescence/tirf/tirfintro.html
TIRFM (or TIRF) was developed by Daniel Axelrod at the University of Michigan, Ann Arbor in the early 1980s. A TIRFM uses evanescent (or vanishing) wave to selectively illuminate and excite fluorophores in a restricted region of the specimen immediately adjacent to the glass-water interface. The evanescent wave is generated only when the incident light is totally reflected at the glass-water interface. The evanescent electromagnetic field decays exponentially from the interface, and thus penetrates to a depth of only approximately 100 nm into the sample medium. Thus the TIRFM enables a selective visualization of surface regions such as the basal plasma membrane (which are about 7.5 nm thick) of cells. However, ,the region visualized is at least a few hundred nanometers wide, so the cytoplasmic zone immediately beneath the plasma membrane is visualized in addition to the plasma membrane during TIRF microscopy. The selective visualization of the plasma membrane renders the features and events on the plasma membrane in living cells with high axial resolution. TIRF can also be used to observe the fluorescence of a single molecule, making it an important tool of biophysics and quantitative biology.
TIRFM 1 – Sample 4 – immersion oil 2 – Evanescent wave range 5 – objective lens 3 – coverslip 6 – emission 7 - excitation
epifluorescence tirf http://physiology.uni-saarland.de/Ute_Becherer/Becherer_Research.html
Fluorescent Recovery After Photobleaching (FRAP) Fluorescence recovery after photobleaching is used to measure the mobility of molecules. A defined area of fluorescently labeled molecules is bleached with intense illumination typically using laser light Recovery of fluorescence is recorded over time. The measured recovery of fluorescence can be fitted with appropriate models (diffusion, transport) leading to diffusion constants, rate of transport or fractions of immobilized molecules. Confocal laser scanning microscopes are all equipped to allow FRAP experiments.
Initial Fluorescent signal Bleach Recovery http://www.zmb.uzh.ch/resources/protocols/FRAP_en.print.html
FLIP (Fluorescence Loss In Photobleaching) is used to measure the rate of protein diffusion in the cell. The protein of interest coupled with the GFP is introduced into cells. A small zone of the cell is regularly bleached. Then fluorescence outside this zone is measured. A reduction in fluorescence outside the zone indicates a diffusion of proteins towards the bleached zone.
FRET (Fluorescence Resonance Energy Transfer) is used in cellular imaging to look for molecular interactions. The method tests if 2 molecules carrying each one a fluorescent group, are close to, or far from each other. The technique is based on the transfer by resonance towards the acceptor, of the energy emitted after excitation of the donor. This transfer can only take place if the emission spectrum of the donor overlaps the absorption spectrum of the acceptor. As this transfer can take place only for distances lower than 100Å, this method makes it possible to say if 2 molecules are or not in interaction.
Coupling of receptor Conformational change