Download
1 / 35
390 likes | 465 Views
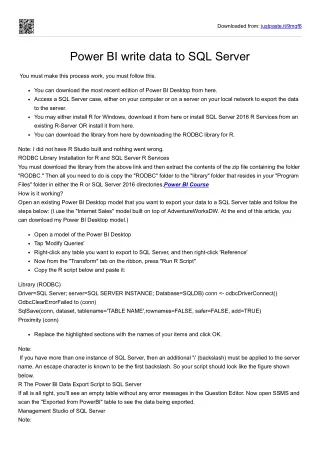
Using Power BI to Automate Data Cleaning and Visualization. Frederick Burrack Director of Assessment Office of Assessment. Chris Urban Assistant Director of Data Analytics Planning & Analysis. Visualizing Data through Interactive Reports in Power BI. Data Dashboards. Survey Results

E N D
Frederick Burrack Director of Assessment Office of Assessment Chris Urban Assistant Director of Data Analytics Planning & Analysis
Survey Results • Form Entries Data Visualization Tool • Assessment Results • Engagement/Clicks Combined, interactive dashboards and reports • Documents • Data Warehouse • Student Demographics • Enrollments
Facts Dimensions Contains items you want to identify: Sum, average, count, etc. Contains fields to break down a Fact Table
Facts Dimensions Long and narrow Duplicated Short and wide Unduplicated
Facts Dimensions DimStudent[StudentID] FactResponses[StudentID] Dimensions relate to Facts. Used as a filter via Key Fields.
Dimensions that surround a Fact Table are called a “Star Schema”
Power BI Suite Power BI Service Power BI Desktop PUBLISH ACCESS Query and Report Creation Power BI Gateways Your Institution’s Data Adapted from Microsoft.com
Data Analysis Expressions An Introduction to DAX
Data Analysis Expressions (DAX) • Functions used to create reusable measures that analyze data • Basic commands such as COUNT, SUM, AVERAGE, etc. • Generally used in Fact tables to aggregate • Can reference other DAX formulas – no need to re-enter data
A Basic Measure using DAX Function Column Used to Calculate Count Responses = COUNT(FactResponses[Response]) Name of the Measure Table used to calculate
Count All Responses = CALCULATE([Count Responses], ALL(DimResponse))
Count Responses = COUNT(FactResponses[Response]) Count All Responses = CALCULATE([Count Responses], ALL(DimResponse)) %Responses = [Count Responses] / [Count All Responses] DAX Measures to count Responses
Count Students = DISTINCTCOUNT(FactResponses[student id]) Count All Students = CALCULATE([Count Students], ALL(DimStudent)) %Students = [Count Students] / [Count All Students] DAX Measures to count students
Publishing and Sharing Power BI Service Power BI Desktop PUBLISH ACCESS Query and Report Creation Power BI Gateways Your Institution’s Data Adapted from Microsoft.com
Request a Pro License ($25/user/yr):https://www.k-state.edu/its/software/software-licenses/ms-power-bi/
K-State Power BI Users Groupemail Chuck Gould – chuck@ksu.edu K-State Power BI Slack Channel ksupowerbi.slack.com
Questions & Discussion Thanks for coming! Using Power BI to Automate Data Cleaning and Visualization