Download
1 / 34
340 likes | 554 Views
The Viability of Wave Energy. Applicability for the Pacific Northwest?. Visual Impact Comparison. Relative Strength of Wave Energy. Best sites are a) North Atlantic b) Gulf of Alaska – units are KW/meter. More Continuous Data. Wave Resource Map. Conceptual Difficulties.

E N D
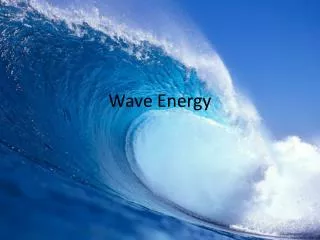
The Viability of Wave Energy Applicability for the Pacific Northwest?
Relative Strength of Wave Energy • Best sites are a) North Atlantic b) Gulf of Alaska – units are KW/meter
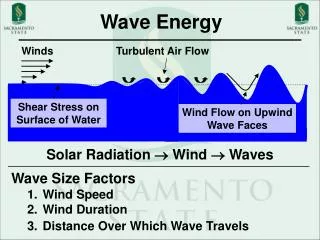
Conceptual Difficulties • In a wave, the energy content is distributed throughout the wave • Therefore, one needs to build a device to focus or collimate that distributed energy • Design challenge then becomes a) how big of device is needed and b) what is the efficiency of converting wave mechanical energy into electricity? • Wave energy is variable hourly and seasonaly but is continous over 24 hours
Three Basic Kinds of Systems • Offshore (so your dealing with swell energy not breaking waves) • Near Shore (maximum wave amplitude) • Embedded devices (built into shoreline to receive breaking wave – but energy loss is occurring while the wave is breaking)
Some Physics • Ocean waves are irregular and are not easily characterized by an average height • Relevant parameter is A, or amplitude of the wave (above mean sea level)
More Physics • Power per meter is the product of the energy density and the wave front velocity (inverse of period) On the PNW coast, values for average wave amplitude and for wave period are such that wave power is in the 30-50 kw/m area. So potential yield along the Oregon Coast, assuming 10% efficiency is: 40 kw/m x 1000 m/km x 600 km = 24000 MW equivalent to PNW Hydro
Devices 1: The Air Piston Incoming wave pushes water level up to basically compress air in a piston to turn the crank on a generator. When water recedes, air comes back into the chamber. This device is known as the oscillating water column (OSC).
OSC Continued Note: Red Line is average sea level – front wall must be located below that line to make a seal so that the air doesn’t rush out – tidal variations are therefore important In principle, one could modify extant coastal headline topography to build these devices.
Difficulties with OWC approach • Initial cost of barrier wall is high – due to lack of access to the site (not easy to build anything on a coastal headland) • Zoning regulations protect most coastal headlands • Rich marine life is often found there • Device must withstand potentially big storms
Unit Capacity of OWC • Physics is similar to that of a wind turbine but wave power is more dense • Yield depends on total square meters of rotor area but efficiencies are very difficult to calculate • Near Shore anchored devices capture highest amount of wave energy but sensitive to local mean sea level • Reliability of waves is about 2 times higher than wind
Unit Capacity/Footprint • Based on existing ON shore facility in India (operational around 1993) • 50 KW plant requires • 100 square meter footprint and 3000 tons of concrete • Scaling up to 100 MW implies 2000 individual 100 square meter installations or roughly 5 per mile along Oregon coastline and this is just for 100 MW
Conclusions about OWC • Shoreline installations probably don’t make sense – even if previous calculation is wrong by a factor of 10 (which is unlikely) • Therefore, look towards large installations in near shore but that could be expensive
Ocean Power Technologies Claim • The footprint of a 100MW conventional power plant, including surrounding grounds, fuel unloading areas, waste settling ponds, and additional facilities can be up to 2 sq miles (not true on average). A comparable OPT power plant would occupy less than 1 square mile of unused ocean surface out for sight from the shore (okay?)
The Tapered Channel Device • Works like a hydroelectric dam Waves rush in to fill reservoir which then drains through a turbine system back into the ocean. Simple idea really. Power depends on total volume of water.
Pros and Cons of TAPCHAN • Could incorporate this into new kinds of seawall/jetty/harbor protection projects • Average wave energy must be high in order to push all the water into the reservoir • Reservoir needs to stay full and can’t drain at low tides • Significant capital cost and large coastal footprint per MW because the depth of the reservoir is shallow • Likely not practical in most locations
The Power Buoy • Video explanation
Power Buoy Continued • Unit capacities are small (20KW) so you need a large network – possibly subject to catastrophic failure in severe weather
An Offshore Buoy Farm Initial prototype was 50 Watts: Scaled capacity for a 12 x15 foot cylinder is 250 KW (on paper) 4000 for 1000 MW farm Principle Advantage: Can Withstand severe Weather
Power Buoy Footprint 80 MW per square KM this is good Don’t need to be anchored to sea floor
But Material Footprint is large • Hard to find real technical data from the vendor • Can scale a couple of known cases • OPT 20KW buy weighs 17 tons • That’s 850 tons of material per MW much more material intensive than wind turbines
The Overtopping Device Similar to TAPCHAN idea but can easily be installed near short instead of on shore. Power basically depends on incoming wave amplitude (height above mean sea level)
The Wave Dragon Project • Ambitious project to harvest up to 10 Gigawatts of Power in the North Atlantic • Floating sea monsters
Pros and Cons of Wave Dragon • In principle this could actually work • Unit capacity appears to be 16 Turbine 4 MW individual dragon • 25,000 then gives you 10 GW of power • Principle challenge is then “grid connection” but scale of project does not seem formidable
Hinged Devices • A large Sea Snake length is important to generate high unit capacities • Material/production scheme similar to wind turbine main shafts
UK Pelamis Project Unit Capacity is 750 KW; Power is generated at each of the hinged locations essentially through a device that converts pressure wave energy into electrical current. Each tube is 150 meters long and 3.5 meters wide UK project employs 7 tubes to generate 5.25 MW Biggest potential problem (besides grid connection) is durability
The Pelamis Project To set the scale of the devices
The Future Sea Snake Farm ? • Footprint argument is favorable: 30MW facility would occupy 1 sq km of ocean. • Look to the UK to seriously develop this resource if initial prototypes prove succesful
New Idea Use Bottom Waves • Wave Roller device anchored to the sea floor (obviously near the cost) • Easiest to build electricit export infrastructure • But energy density is lower; still prototypes are being developed
Summary • There is much potential in worldwide wave energy; 1000 TerraWatts available • Capturing wave energy and converting that into electricity is difficult but this allows for innovate devices to be designed • Large scale projects very capital intensive • Optimum technology not yet discovered so best to experiment • Surface sea snakes may be best option
Potential Local Projects • OPT facility at off shore from Reedsport • Oregon State wave energy research facility at newport • Tidal power project in Tacoma Narrows