Download

1 / 66
680 likes | 942 Views
BIOL 4120: Principles of Ecology Lecture 9: Population Growth and Regulation. Dafeng Hui Office: Harned Hall 320 Phone: 963-5777 Email: dhui@tnstate.edu. World population. Outline. 9.1 Population grow by multiplication rather than addition 9.2 Age structure influences population rate

E N D
BIOL 4120: Principles of Ecology Lecture 9: Population Growth and Regulation Dafeng Hui Office: Harned Hall 320 Phone: 963-5777 Email: dhui@tnstate.edu
Outline • 9.1 Population grow by multiplication rather than addition • 9.2 Age structure influences population rate • 9.3 A life table summaries age-specific schedules of survival and fecundity • 9.4 The intrinsic rate of increase can be estimated from the life table • 9.5 Population size is regulated by density-dependent factors
9.1 Populations grow by multiplication rather than addition Definition: Population growth, how the number of individuals in a population increases or decreases with time Growth is controlled by rates of birth, immigration and death and emigration. Open or closed population: no immigration and emigration, or immigration rate=emigration rate. In closed population, growth is determined by birth rate and death rate. Rate of growth is on a per capita basis. Demography: study of population.
Calculating population growth rates Geometric growth Assume a population, at t=0, population size is N(0), ratio of population size change in one year to the size of the proceeding year is . If at time t, population size is N(t), then at time t+1, N(t+1)=N(t) So N(1)=N(0), N(2)=N(1) =N(0) 2 thus N(t) = N(0) t geometric growth model.
Geometric growth curve: N(0)=100, =1.5 (a): y on a arithmetic scale; (b) y on a logarithmic scale.
Exponential growth • Nt=N0exp(rt) • Where r is the exponential growth rate • Compare to N(t)=N(0) t • =exp(r) or r=ln() • These models are used to describe dynamics of populations. Geometric growth is used for population generations not overlap (discrete time interval), exponential growth model is for continuous population.
Population size change and model parameter Increasing population, >1, r>0 Constant pop. Size, =1, r=0 Decreasing population, 0<<1, r<0
Calculating population growth rates from birth and death rates • In a closed population, population size change is related to birth rate (b) and death rate (d) • The difference between birth rate and death rate is the intrinsic growth rate (r) (instantaneous per capita rate of growth). r=b-d • Population growth is related to this intrinsic growth rate (r). • dN/dt=(b-d)N=rN
Exponential population growth • Equations: • 1) dN/dt=rN (differential equation form) • 2) Nt=N0 exp(rt) (exponential growth model) • Conditions: • Initial population is small • No food or resource limitation
An example Started in 1910 with only 4 males and 22 females In 1940, there were nearly 2000 Reindeer, St. Paul, Alaska.
Whooping crane, an endangered speciesrecovered from near extinction in 1941 How to calculate r? Software, Excel (trendline) Arkansas National Wildlife Refuge
Prediction of population growth Nt=N0Exp(rt) Give a time t, we can predict the population size. An Example: Deer population: N0=300, r=0.5, after 5 years, what’s the population size? N5=N0 Exp(rt)=300*exp(0.5*5)=3655 (495, 815, 1344, 2216, 3655) t=10, ? 44,524
9.2 Age structure influences population growth rate • Age structure: the proportions of each individual in each age class. • Age structure influences population growth rate, as only mature adults can reproduce and increase population size. • A life table is an age-specific account of mortality
Age distribution Stable age distribution: by year 7, the proportion of each age group remain the same year after year. Population is still growing at a constant rate.
In a stable age distribution, each age class grows at the same rate
Age structure of human population (2008 data) Different countries (a) Stable for many years; (b) high birth (growth) rate
Population structure change over time in German Birth rates are declining in many human populations
9.3 Life table summaries age-specific schedules of survival and fecundity • Life table is an age-specific account of mortality. • Purpose of life table: to provide a clear and systematic picture of mortality and survival within a population. Can also be used to simulate population size change.
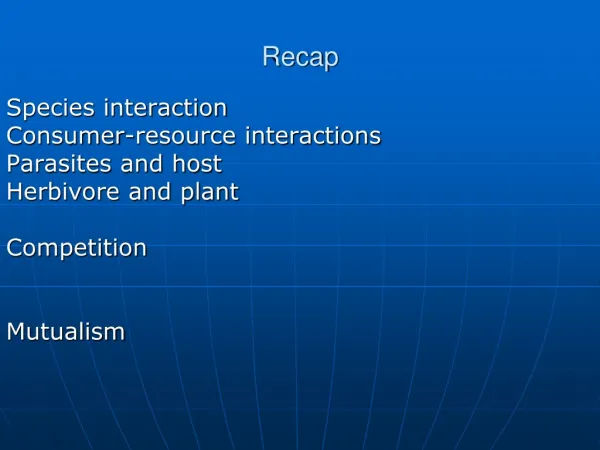
Recap Population growth Growth models: Geometric growth model vs Exponential growth model Life table and use life table to predict population growth Age structure
Two types of life tables • Two types • Cohort or dynamic life table • as the above flycatcher, (plants, sessile animals) • Time-specific or static life table
9.4 Life tables provide data for mortality and survivorship curves • Table is better than words, but a graph is worth one thousand words. • Mortality curve and survivorship curve.
Survivorship curves I. deer, sheep, human, convex II: squire and adult birds, linear, not change with age III. Plants, fish, young bird, concave Log scale for Y axis
9.5 Intrinsic rate of increase can be estimated from the life table Crude birthrate (demographers): # of birth over a period of time divided by population size at the beginning of the period*1000 Age-specific birthrates, bx Mean # of females birth to a female in each age group. (Only females give birth; birth rates vary with ages) Gross reproduction rate: sum of the bx values across all age classes, provides an estimate of average offspring born to a female over her lifetime.
Birth rate and survivorship determine net reproductive rate • Fecundity table: take survivorship column, lx, from life table and add age-specific birthrate, bx.
Birth rate and survivorship determine net reproductive rate • Net reproduction rate, R0: number of female offspring a female at birth can produce (or average # of females that will be produced (left) during a lifetime by a newborn females.) • R0: depends on survivorship and fecundity • R0 =1, • >1 • or <1
Generation time and growth rate • Generation time: average age at which an individual gives birth to its offspring • T=Sum(xlxbx)/sum(lxbx) • T=4.2/2.1=1.95 • N(t)/N(0)= t (T=1.95) • If t=T, then R0= N(T)/N(0), then R0=T • =R01/T=2.11/1.95 =1.46; r = ln()=0.38
The growth potential of populations • Capacity of population growth: • Pheasants: 2 males +6 females in 1937 • in 5 years, 1325 (r=1.02, =2.78) • Elephant seal: in 1900, N0=100 2000: 150,000 (r=0.073, =1.076) 2100: 225 millions Field vole: =24 Water flee: =1030
The growth potential of populations Doubling time: t2 =ln(2)/ln() or t2 =ln(2)/r • Field vole: t2=0.22 yr, 79 days (=24) • Pheasants: t2=246 days (r=1.020) • Water flea, t2=3.6 days (r=69.07) • [Ln(2)=0.693, if r=0.01, t2=69.3]
Exponential growth model can not explain the population growth here Need other equation or model Barnacle
Birth rate and death rate change with population size N dN/dt=rN r=b-d b=b0-aN d=d0+cN dN/dt=[(b0-d0)-(a+c)N]N dN/dt=(b0-d0)[1-(a+c)/(b0-d0)*N]N dN/dt=r N(1-N/K) K=(b0-d0)/(a+c) K: carrying capacity: maximum sustainable population size under prevailing environment.
Logistic Population Growth • As resources are depleted, population growth rate slows and eventually stops: logistic population growth. • Sigmoid (S-shaped) population growth curve. • Carrying capacity (K) is the number of individuals of a population the environment can support. • (r) is per capita increase rate.
9.7 Population size is regulated by density dependent factors • Environment limits population growth by altering birth and death rates. • Density-dependent factors • E.g., Disease, Resource competition • They influence a population in proportion to its size • Resulted in slowing the rate of increase • Density-independent factors • E.g., Natural disasters • Influence population without regard to the # of individuals or if the proportion of individuals affected is the same at any density
Density dependence in animals Fecundity and life span of fruit fly decrease as population density increase Lab study
A long-term field study of common terns. Population started with 200, and leveled off after suitable nest sites are occupied on the Bird Island. Birds started to colonize Ram Island.
Why level off? Density-dependent factors can control the size of natural population. Song sparrow (a) As density increases, more males can’t find territories; (b) number of fledglings produced per female and survival of those offspring (c) decrease.
Range quality influence percentage of white-tailed deer female pregnant and average number of embryos Selective hunting may improve population caused by overgrazing.
Positive density dependence Negative density dependence: common (right panel) Positive (or inverse) density dependence: left panel A: herring near iceland B: herring near North Sea Allee effect: with increase in density, easy to find mates, defend predators, increase diversity etc.
Allee effects also occur in plant population. Reproduction of Primula veris (a small herbaceous plant grow in nutrient poor grasslands) show positive density dependence. Seed mass is the average mass of individual seed. (pollination?)