Download

1 / 27
270 likes | 399 Views
香港大學民意研究計劃 The University of Hong Kong Public Opinion Programme. Opinion Survey on the Public Ranking of Universities in Hong Kong 2008 Presentation of Findings. By Karie Pang 28 July 2008. Outline of Presentation. Background information Demographic profile of respondents

E N D
香港大學民意研究計劃 The University of Hong Kong Public Opinion Programme Opinion Survey on the Public Ranking ofUniversities in Hong Kong 2008Presentation of Findings By Karie Pang 28 July 2008
Outline of Presentation • Background information • Demographic profile of respondents • Ratings of universities and their heads • Public perception of graduates • Conclusion
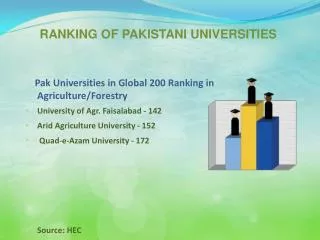
History • Commissioned by Media Education Info-tech Co. Ltd. (MEIT, which owns “Education18.com”) since 2001, this is the 8th survey in the row. • Key objective is to gauge the general public’s perception of eight institutions of higher education funded through University Grants Committee (UGC) while Hong Kong Shue Yan University is included for the first time this year, as well as their opinions on qualities of university students. • The survey questionnaire was designed by HKU POP after consulting MEIT. • Fieldwork and data analysis conducted independently by POP, but final rankings wholly or partly based on perception figures are compiled independently by MEIT.
Contact Information Date of survey: June 26 – July 4, 2008 Target population: Cantonese-speaking population of Hong Kong of age 18 or above Survey method: Telephone survey with interviewers Sample size: 1,213 successful cases Response rate: 65.5% Sampling error: Less than 1.4% Weighting method: Data adjusted according to the gender-age distribution of HK population at the end 2007
Notes of Caution • Findings only reflect general public perception of the nine institutions and their leaders, they are not results of objective appraisals or professional assessments. • Absolute ratings (i.e. 0-10) are used in the key questions, they are methodologically more powerful than relative rankings, because the score received by each institution in any one year is independent of the scores of other institutions, or its own score in another years. • Sequence of prompting respondents with the name of nine institutions was randomly rotated to avoid possible bias. • All respondents have been told at the beginning of the interview that POP was an independent research body.
Demographic Profile of Respondents
Gender Valid samples:1,213
Age Distribution Valid samples:1,177
Education Attainment Valid samples:1,208
Occupation Valid samples:1,195
Public Ratings of Universities and their Heads
Overall Performance of University * 90% 91% 86% 88% 85% 84% 78% 80% 76% * Recognition rate = No. of raters/total sample# Newly added in 2008 survey Valid samples (2008):926-1,098
Cross-tabulation Analyses: University Ratings vs Respondents’ Education Attainment ^ Differences among sub-groups tested to be statistically significant at 95% confidence level.
Cross-tabulation Analyses: University Ratings vs Respondents’ Occupational Background 7.84 7.71 7.73 7.64 7.56 7.48 7.34 7.30 7.17 7.26 6.95 7.04 6.96 6.92 6.89 6.63 6.65 6.45 6.35 6.22 6.56 6.42 6.18 6.20 6.13 6.29 6.01 5.80 5.71 5.49 6.11 5.82 5.44 5.58 5.47 6.11 5.61 5.47 5.38 5.40 ^ Differences among sub-groups tested to be statistically significant at 95% confidence level.
Public Ratings of University Heads * 64% 67% 55% 58% 55% 46% 54% 36% 42% * Recognition rate = No. of raters/total sample^ In 3-decimal places, HKU – LC Tsui scores 7.671 while HKUST – Paul Chu scores 7.665 Valid samples (2008):439 – 813
Cross-tabulation Analyses: Ratings of University Heads vs Education Attainment ^ Differences among sub-groups tested to be statistically significant at 95% confidence level.
Cross-tabulation Analyses: Ratings of University Head vs Respondents’ Occupation HKU – Lap-chee Tsui HKUST – Paul C.W. Chu CUHK – Lawrence J. Lau PolyU – Chung-kwong Poon HKBU – Ching-fai Ng HKSYU – Chi-yung Chung^ HKIEd – Anthony B.L. Cheung CityU – Way Kuo LU – Yuk-shee Chan ^ Differences among sub-groups tested to be statistically significant at 95% confidence level.
Public Perception of University Students and Graduates
Perceived Deficiencies of University Students* (I) ^Changes being statistically significant at 95% confidence level. Proficiency in Chi, Eng and PTH Conduct and honesty^ Social / interpersonal Skills Critical thinking and problem- solving ability Global prospect / foresight Social / work experience Commitment to society^ Academic and professional Knowledge^ Work attitude * The question wording used for the 2005 survey was “university graduates” instead of “university students”, so comparison could only be made on a rough basis. Total samples (2008):1,213
Perceived Deficiencies of University Students* (II) ^Changes being statistically significant at 95% confidence level. Communication skills Self- Confidence^ Emotional stability Financial management Creativity Patriotism Nothing Others^ Don’t know^ Note: Attributes registering less than 1% for all years are not shown here. Total samples (2008):1,213 * The question wording used for the 2005 survey was “university graduates” instead of “university students”, so comparison could only be made on a rough basis.
Most Preferred University Graduates[Only for respondents involved in recruiting new staff] Oversea universities Won’t employ Don’t know No preference HKU PolyU CUHK HKUST HKBU HKIEd HKSYU LU CityU Others Valid samples (2008): 194 Standard error (for 2008 at 95% confidence level): +/-7.1%
Reasons for Graduate Preferences[Only for respondents involved in recruiting new staff and with preferences on university graduates] Good performance of previous graduates Good knowledge in job-related areas Good language ability Diligent / motivated Good work attitude Good connection with outside Reputation Alumni Others Valid samples (2008): 129 Standard error (for 2008 at 95% confidence level): +/-7.1% Note: Reasons registering less than 6% for all years are not shown here.
Conclusion • Between 2001 and 2008, HKU continues to be perceived by the public as the best performing university, with CUHK & HKUST consistently taking the 2nd and 3rd ranks. • Professors Lap-chee Tsui of HKU and Paul Chu of HKUST are perceived as the best performing university heads this year. • “Work attitude”, “language proficiency” and “conduct, honesty” are perceived to be important qualities which most Hong Kong university students lack of. • Of the 194 potential employers interviewed, most preferred employing HKU, PolyU, CUHK and HKUST graduates, while 21% had no special preference. Main reasons for their choice were “good performance of previous graduates”, and “good knowledge in job-related areas” of the graduates.
Public Enquiry Welcome • To enhance more rational discussions on university ranking surveys, local and non-local, a special on-line feature page entitled “university ranking surveys” has been set up at the HKU POP Site at http://hkupop.hku.hk to serve as an information hub and one-stop service point for the public. • The feature page also contains a list of frequently asked questions (FAQs) and model answers, first prepared in 2005. One print copy of all FAQs have been distributed to the press. • Journalists and members of the general public are welcome to contribute questions to the FAQ list, all questions and answers will be open to the general public.
End of Presentation Thank you!