Download
1 / 27
290 likes | 753 Views
Unit 1.2 River Regimes & Hydrographs. So …. We were working our way toward the idea that flooding is one of the problems within in river basins I hope we also got to the idea that we would need to link rainfall with how much water and how quickly the water reaches the river.

E N D
So …. • We were working our way toward the idea that flooding is one of the problems within in river basins • I hope we also got to the idea that we would need to link rainfall with how much water and how quickly the water reaches the river. • And that this was to an extent dependent on some of the features of the river basin – the things that make the run-off slower or faster • We have a geographical technique that can show how the rainfall and amount of water in river channels – or even outside of the river channel if the rainfall is very heavy – can be linked.
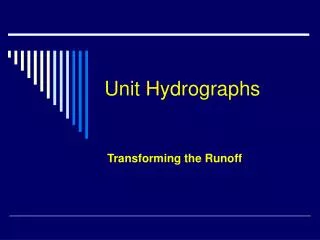
So …. • If we measure the rainfall and put it on a time graph and link that to the amount of water in the river, we have some really useful information! • This graph is hydrograph. It plots rainfall against discharge (that is the amount of water in the river as it passes a particular point measured in cubic metres per seconds or cumecs). • Changes measured over time is river regime - eg in winter more rain, less evaporation, less vegetation to absorb it.
This what a hydrograph looks like Often you will have mm for rain on the left vertical axes and cumecs on the right vertical axis
Words & Ideas • Lag time: peak discharge – peak rainfall • The angle of the rising limb (the line from Normal or base flow up to peak flow) is very dependent on how quickly the water in the river rises. • The peak flow depends on how much of the rainfall actually ends up in the river – does some evaporate or does it soak into the ground or does it all run straight down the slope into the river?
Variations in discharge: • How would climate affect lag time? Discharge? • How would vegetation (or lack of it) affect lag time? Discharge? • How would steepness (or lack of it) affect lag time? Discharge? • How would rock type affect lag time? Discharge? • How the size of the drainage basin affect lag time? Discharge? • How would urbanisation affect lag time? Discharge? • How might abstraction/ dams affect discharge?
Variations in discharge - summary • Climate (amount/intensity of rain influence lag time); • Lots of trees/vegetation increase intercept, slow lag time – bare ground speeds it up • Relief – steep slopes increase speed of run-off • Flat land: water infiltrates soil, less run-off • Rock type – impermeable run-off, permeable infiltrate • large drainage basin takes longer • Tarmac speeds up run-off • Abstraction/ dams affect discharge
Here are 4 hydrographs, each with outputs from 2 different conditions on them. • We will look at them one at a time, notice the differences in the graph and then decide which is which!
These 2 are different because they have different sized drainage basins – one small and one large Recall that the blue graph on the lower left is telling you how many mm of rainfall fell in the area First of all, how are the 2 graphs different from one another? Now which is the large basin and which is the small one? Explain Graph A
These 2 different types of ground cover in their basins – one is mostly bare earth, while the other well forested First of all, how are the 2 graphs different from one another? Now which is the bare earth basin and which is forested. Explain. Graph B
These 2 different shapes of basin – one has gently sloping sides and the other is very steep sided. First of all, how are the 2 graphs different from one another? Now which is gently sloping and which is steep sided? Explain. Graph C
These 2 basins have different kinds of rock. One of them has permeable rock while the other has impermeable rock. Do you know the difference? First of all, how are the 2 graphs different from one another? Now which has permeable rock and which has impermeable rock? Explain. Graph D
Homework • There is a blank graph in word. • It has some data for you to fill in and some labels round it for you to draw lines to the points on the graph. • Instructions are on the sheet as to how to do it on your computers
Introduction • Main job of river is to transfer water from source to sea. • Most energy is used to keep the water flowing, as it needs to overcome the friction of the bed and the banks. • Any spare energy wears away the banks and carries a load. • What is the load of a river likely to be?
Besides getting to the sea, …. • The 3 processes a river is involved in are • The wearing away of the river banks • The movement of rocks and silt from one place to another • The setting down of the river’s load • River is • an agent of erosion • an agent of transport • an agent of deposition • Agent = something that is capable of causing a certain effect.
Erosion Transportation Deposition
Corrasion or abrasion is the grinding of rock fragments carried by the river against the bed and banks of the river. This action causes the channel to widen and deepen. This grinding is most powerful in flood time when large fragments of rock are carried along in the river bed. Erosion
Attrition is the collision of rock fragments in the water against one another. The rock particles are broken into smaller pieces and become smoother the longer the process continues. Erosion
Erosion – the last 2! • Solution or corrosion is the process by which river water reacts chemically with soluble minerals in the rocks and dissolves them. • An additional process is also at work caused by the force of the water itself known as Hydraulic action. • In this rocks are dragged away from the bed and banks by the force of the running water. • When water from a fast moving stream enters minute cracks in a rock, the pressure exerted weakens and eventually breaks up the rock
Transportation • Tractionis where boulders or stones are rolled along the stream bed by the force of the water. • Saltationis where pebbles or small stones are bounced along the stream bed by the force of the water.
Transportation • Suspension is when fine particles such as clay, silt and fine sand are carried along in the river. • Solution is when dissolved materials containing minerals like calcium and sodium are carried in the water and are invisible to the naked eye.
Deposition • This happens when the river no longer has enough energy to carry the load • When the river is in full flood like the Wye last weekend, the river has enough energy to transport large rocks and tree trunks as well as smaller stuff and mud in suspension, turning the river a murky brown • However, at some point later on, after the rain has eased off, less run-off will be reaching the river and the larger stuff, will be deposited as the river slows and the is less capacity. • In addition, in general, the more level the river channel, the smaller the load that can be transported, with anything to large being deposited.
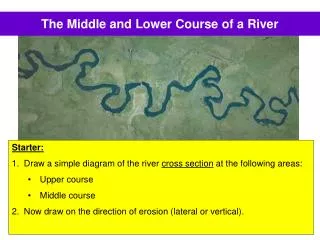
So if you look on the river bank and see what has been deposited there, you have a good idea of whether you are looking at the upper course, the middle course or the lower course.
For: Transportation Erosion Deposition Which of these dominate depends on the geology, the slope and the speed of the river. For instance, if the rock is hard, there will be very little erosion In the upper course the speed of flow is slower due to friction so vertical erosion, counts more. Transportation only takes place when there is heavy rainfall and the capacity is raised. In the middle course, the speed is greater. However larger load items deposited while the sediment is still carried because there is quite a bit of lateral erosion. In lower course it is even slower and only silt is carried and very little erosion is carried out. However, after rain, there is more water going faster and so there is more erosion and transportation. So in general the gradient becomes more gentle as the river goes down stream, the channel becomes wider and deeper; velocity and discharge increases; more sediment is carried. What the river does and where
In summary • You need to the know the 3 processes and the various ways they are achieved • Erosion: Corrasion or abrasion, Attrition, Solution or corrosion, Hydraulic action. • Transportation: traction, saltation, suspension & solution • Deposition • That there is vertical erosion in the upper course, lateral erosion in the middle course and not much erosion in the lower course.
This was quite short BUT… • There a lot of awkward words to learn. • On the worksheet, join the words to their explanations and then in each little box by the word, try and draw something to remind you of what it means! • There will be a HotPotatoes quiz for the homework for this section.