Download
1 / 35
350 likes | 437 Views
Household Air Pollution and Health in Laos Kirk R. Smith, MPH, PhD Professor of Global Environmental Health University of California, Berkeley Fulbright-Nehru Distinguished Chair IIT-Delhi – 2013/14. The three major solid fuels. Population Cooking with Solid Fuels in 2010 (%).

E N D
Household Air Pollution and Health in LaosKirk R. Smith, MPH, PhDProfessor of Global Environmental HealthUniversity of California, BerkeleyFulbright-Nehru Distinguished ChairIIT-Delhi – 2013/14
Population Cooking with Solid Fuels in 2010 (%) Leading cause of disease burden in 2010 by country
Total Population Cooking with Solid Fuels Bonjour et al., CRA-2010
1990: 85%: 700 million people using solid fuels 2010: 60%: 700 million people ~1980 700 million people in entire country
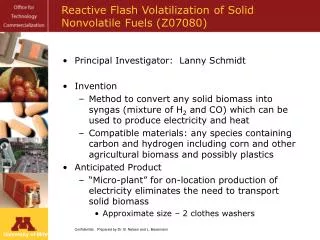
Woodsmoke is natural – how can it hurt you? Or, since wood is mainly just carbon, hydrogen, and oxygen, doesn’t it just change to CO2 and H2O when it is combined with oxygen (burned)? Reason: the combustion efficiency is far less than 100%
A Toxic Waste Factory!! Typical biomass cookstoves convert 6-20% of the fuel carbon to toxic substances Energy flows in a well-operating traditional wood-fired cookstove 15% moisture Source: Smith, et al., 2000 PIC = products of incomplete combustion = CO, HC, C, etc.
Toxic Pollutants in Biomass Fuel Smokefrom Simple (poor) Combustion • Small particles, CO, NO2 • Hydrocarbons • 25+ saturated hydrocarbons such as n-hexane • 40+ unsaturated hydrocarbons such as 1,3 butadiene • 28+ mono-aromatics such as benzene & styrene • 20+ polycyclic aromatics such as benzo()pyrene • Oxygenated organics • 20+ aldehydes including formaldehyde & acrolein • 25+ alcohols and acids such as methanol • 33+ phenols such as catechol & cresol • Many quinones such as hydroquinone • Semi-quinone-type and other radicals • Chlorinated organics such as methylene chloride and dioxin Typical chullah releases 400 cigarettes per hour worth of smoke Source: Naeher et al, J Inhal Tox, 2007
First person in human history to have her exposure measured doing the oldest task in human history Emissions and concentrations, yes, but what about exposures? ~5000 ug/m3 during cooking >500 ug/m3 24-hour Kheda District, Gujarat, 1981
How much PM2.5 is unhealthy? • WHO Air Quality Guidelines • 10 ug/m3 annual average • No public microenvironment, indoor or outdoor, should be more than 35 ug/m3 • National standards – annual outdoors • USA: 12 ug/m3 • China: 35 ug/m3 • India: 40 ug/m3
CRA published along with the other GBD papers on Dec 14, 2012 in The Lancet
Annual Review of Public Health, vol 35, 2014, to be published in March
Definitions • Global Burden of Disease (GBD) • Envelope of death, illness, and injury by age, sex, and region. • Coherent – no overlap – one death has one cause • Comparative Risk Assessment (CRA) • The amount of the GBD due to a particular risk factor, e.g. smoking • Not coherent – deaths can be prevented by several means
Metrics • Mortality – important, but can be misleading as it does not take age into account or years of illness/injury • Death at 88 years counts same as at 18, which is not appropriate • Disability-adjusted Life Years (DALYs) lost do account for age and illness. • GBD 2010 compares deaths against best life expectancy in world – 86 years
Comparative Risk Assessment Method Exposure-response Relationships (risk) Exposure Levels: Past actual and past counterfactual Disease Burden by age, sex, and region Attributable Burden by age, sex, and region
State-wise estimates of 24-h kitchen concentrations of PM2.5 in India Solid-fuel using households Balakrishnan et al. 2013 (SRU group)
“12 h mean PM10 concentrations 1275 (=/-98 μg m-3 and 1183 ( =/-99 μg m-3 in Vientiane and Bolikhamxay provinces, respectively. However, no significant differences in pollutant concentrations were observed as a function of cooking location.”
COPD ALRI/ Pneumonia Lung cancer (coal) Lung cancer (biomass) Cataracts Ischemic heart disease Stroke Diseases for which we have epidemiological studies These diseases are included in the 2010 Comparative Risk Assessment (released in 2012)
Global DALYs 2010: Top 20 Risk Factors Premature Deaths HBP -9.3 million Alcohol – 7.7 Tobacco – 5.7 SHS-T – 0.6 House AP – 3.5 SHS-C – 0.5 High BMI – 3.4 Phys Inactive – 3.2 Outdoor AP – 3.3 High Sodium – 3.1
Framing, cont. • Not called “indoor” because stove smoke enters atmosphere to become part of general outdoor air pollution (OAP) • HAP contributes about 12% to OAP globally, but much more in some countries • ~25% in India • Thus, part of the burden of disease due to OAP is attributable to cooking fuels in households ~150,000 premature deaths in India.
%PM2.5 from “Residential” Emissions from INTEX_B 18% of primary particle pollution in SE Asia is from household fuels Source: Asian Emission Inventory for NASA INTEX_B 2006 (accessed 2010) 24 Chafe, 2010
New Category of Evidence for CVD • No direct studies of CVD and HAP, yet • But studies showing effects on blood pressure and ST-segment, important disease signs • Epidemiologic evidence shows clear, consistent evidence of increasing risk across exposures to combustion particles • at higher exposures – Active smoking • and lower exposures – Outdoor air pollution and secondhand tobacco smoke
Heart Disease and Combustion Particle Doses From “Mind the Gap,” Smith/Peel, 2010 and Pope et al., 2009 HAP Zone
Smokers Secondhand Tobacco Smoke Outdoor Air Pollution HAP Zone Integrated Exposure-Response: Ischemic Heart Disease CRA, 2011
Stroke ALRI COPD Ischemic Heart Disease Lung Cancer ug/m3 annual average PM2.5
Summary • One of the top risk factors in the world for ill-health. • Biggest impact in adults --3 million premature deaths (two-thirds the DALYs) • Still important for children ~500,000 deaths (one-third the DALYs) • Important source of outdoor air pollution • Impact going down slowly because background health conditions improving • Actual number of people affected is not going down globally or in Laos
Bottom line #1 • Implied health benefit from HAP reduction only potentially achieved by shifting to clean completely cooking. • No biomass stove in the world yet clean enough to obtain all these benefits - much more effort needed • Including matching with people’s needs and enhancing usage/adoption
Exposure-response relationship Child pneumonia Risk 3 WHO air quality annual guideline: 10µg/m3 IT1 : 35 µg/m3 If you start here Even if you get here 2 It leaves ~80% of burden untouched PM2.5 Exposure 1 LPG Rocket ‘Chimney O/Fire Fan 25 125 200 300 µg/m3
Bottom Line #2 • Clean cooking now only achievable with gas and/or electric cooking • High priority needs to be given to expanding gas and electricity to all households • Usage/adoption still issues, but not emissions
Bottom lines, restated • In addition to continuing to try to Make the available clean • Shouldn’t we also try to Make the clean available?
Many thanks Publications and presentations on website – easiest to just “google” Kirk R. Smith