Download
1 / 1
10 likes | 95 Views
MORE EXAMPLES OF D3D DISPLAYS FOR OTHER WEATHER SCENARIOS. A comparison between viewing vorticity with D2D and D3D: 15 October 2002.

E N D
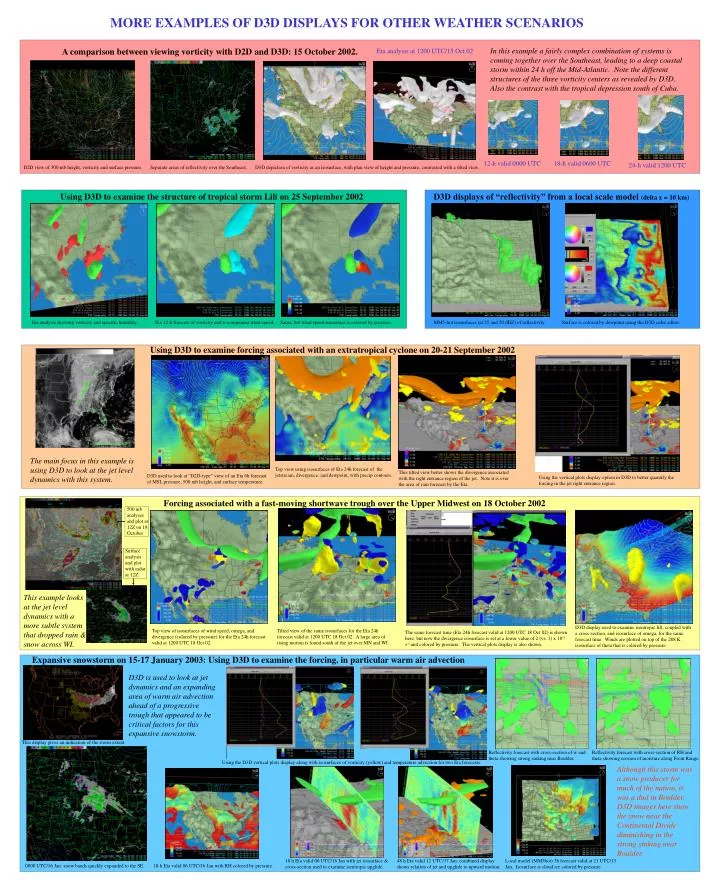
MORE EXAMPLES OF D3D DISPLAYS FOR OTHER WEATHER SCENARIOS A comparison between viewing vorticity with D2D and D3D: 15 October 2002. In this example a fairly complex combination of systems is coming together over the Southeast, leading to a deep coastal storm within 24 h off the Mid-Atlantic. Note the different structures of the three vorticity centers as revealed by D3D. Also the contrast with the tropical depression south of Cuba. Eta analysis at 1200 UTC/15 Oct 02 12-h valid 0000 UTC 18-h valid 0600 UTC 24-h valid 1200 UTC D2D view of 500 mb height, vorticity and surface pressure. Separate areas of reflectivity over the Southeast. D3D depiction of vorticity as an isosurface, with plan view of height and pressure, contrasted with a tilted view. Using D3D to examine the structure of tropical storm Lili on 25 September 2002 D3D displays of “reflectivity” from a local scale model (delta x = 10 km) Eta analysis showing vorticity and specific humidity. Eta 12-h forecast of vorticity and v-component wind speed. Same, but wind speed isosurface is colored by pressure. MM5-hot isosurfaces (at 25 and 50 dBZ) of reflectivity. Surface is colored by dewpoint using the D3D color editor. Using D3D to examine forcing associated with an extratropical cyclone on 20-21 September 2002 The main focus in this example is using D3D to look at the jet level dynamics with this system. Top view using isosurfaces of Eta 24h forecast of the jetstream, divergence, and dewpoint, with precip contours. This tilted view better shows the divergence associated with the right entrance region of the jet. Note it is over the area of rain forecast by the Eta. D3D used to look at “D2D-type” view of an Eta 6h forecast of MSL pressure, 500 mb height, and surface temperature. Using the vertical plots display option in D3D to better quantify the forcing in the jet right entrance region. Forcing associated with a fast-moving shortwave trough over the Upper Midwest on 18 October 2002 500 mb analyses and plot at 12Z on 18 October Surface analysis and plot with radar at 12Z This example looks at the jet level dynamics with a more subtle system that dropped rain & snow across WI. D3D display used to examine isentropic lift, coupled with a cross-section, and isosurface of omega, for the same forecast time. Winds are plotted on top of the 288 K isosurface of theta that is colored by pressure. Top view of isosurfaces of wind speed, omega, and divergence (colored by pressure) for the Eta 24h forecast valid at 1200 UTC 18 Oct 02. Tilted view of the same isosurfaces for the Eta 24h forecast valid at 1200 UTC 18 Oct 02. A large area of rising motion is found south of the jet over MN and WI. The same forecast time (Eta 24h forecast valid at 1200 UTC 18 Oct 02) is shown here, but now the divergence isosurface is set at a lower value of 2 (vs. 3) x 10-5 s-1 and colored by pressure. The vertical plots display is also shown. Expansive snowstorm on 15-17 January 2003: Using D3D to examine the forcing, in particular warm air advection D3D is used to look at jet dynamics and an expanding area of warm air advection ahead of a progressive trough that appeared to be critical factors for this expansive snowstorm. This display gives an indication of the storm extent. Reflectivity forecast with cross-section of w and theta showing strong sinking near Boulder. Reflectivity forecast with cross-section of RH and theta showing erosion of moisture along Front Range. Using the D3D vertical plots display along with isosurfaces of vorticity (yellow) and temperature advection for two Eta forecasts. Although this storm was a snow producer for much of the nation, it was a dud in Boulder. D3D images here show the snow near the Continental Divide diminishing in the strong sinking near Boulder. 18 h Eta valid 06 UTC/16 Jan with jet isosurface & cross-section used to examine isentropic upglide. 48 h Eta valid 12 UTC/17 Jan: combined display shows relation of jet and upglide to upward motion. Local model (MM5hot) 3h forecast valid at 21 UTC/15 Jan. Isosurface is cloud ice colored by pressure. 0000 UTC/16 Jan: snow bands quickly expanded to the SE. 18 h Eta valid 06 UTC/16 Jan with RH colored by pressure.