Download
1 / 1
10 likes | 56 Views
Carbon Dioxide Mediated Opening of Connexin-26 hemi-channels in the Cortex. Introduction

E N D
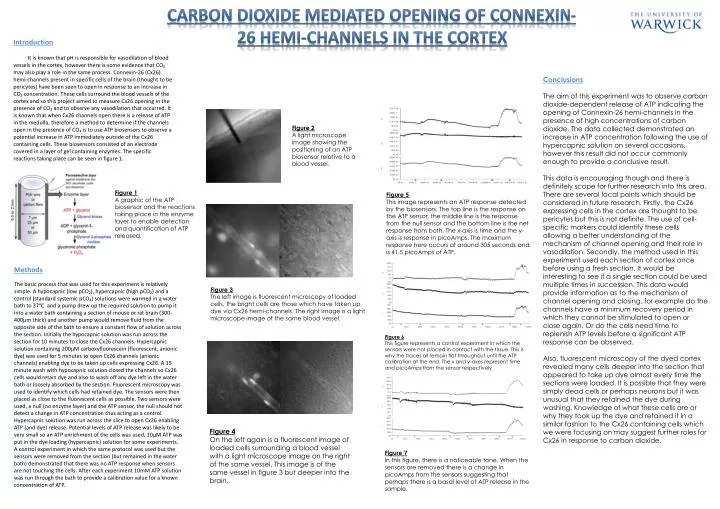
Carbon Dioxide Mediated Opening of Connexin-26 hemi-channels in the Cortex Introduction It is known that pH is responsible for vasodilation of blood vessels in the cortex, however there is some evidence that CO₂ may also play a role in the same process. Connexin-26 (Cx26) hemi-channels present in specific cells of the brain (thought to be pericytes) have been seen to open in response to an increase in CO₂ concentration. These cells surround the blood vessels of the cortex and so this project aimed to measure Cx26 opening in the presence of CO₂ and to observe any vasodilation that occurred. It is known that when Cx26 channels open there is a release of ATP in the medulla, therefore a method to determine if the channels open in the presence of CO₂ is to use ATP biosensors to observe a potential increase in ATP immediately outside of the Cx26 containing cells. These biosensors consisted of an electrode covered in a layer of gel containing enzymes. The specific reactions taking place can be seen in figure 1. Conclusions The aim of this experiment was to observe carbon dioxide-dependent release of ATP indicating the opening of Connexin-26 hemi-channels in the presence of high concentrations of carbon dioxide. The data collected demonstrated an increase in ATP concentration following the use of hypercapnic solution on several occasions, however this result did not occur commonly enough to provide a conclusive result. This data is encouraging though and there is definitely scope for further research into this area. There are several focal points which should be considered in future research. Firstly, the Cx26 expressing cells in the cortex are thought to be pericytes but this is not definite. The use of cell-specific markers could identify these cells allowing a better understanding of the mechanism of channel opening and their role in vasodilation. Secondly, the method used in this experiment used each section of cortex once before using a fresh section. It would be interesting to see if a single section could be used multiple times in succession. This data would provide information as to the mechanism of channel opening and closing, for example do the channels have a minimum recovery period in which they cannot be stimulated to open or close again. Or do the cells need time to replenish ATP levels before a significant ATP response can be observed. Also, fluorescent microscopy of the dyed cortex revealed many cells deeper into the section that appeared to take up dye almost every time the sections were loaded. It is possible that they were simply dead cells or perhaps neurons but it was unusual that they retained the dye during washing. Knowledge of what these cells are or why they took up the dye and retained it in a similar fashion to the Cx26 containing cells which we were focusing on may suggest further roles for Cx26 in response to carbon dioxide. Figure 2 A light microscope image showing the positioning of an ATP biosensor relative to a blood vessel. Figure 1 A graphic of the ATP biosensor and the reactions taking place in the enzyme layer to enable detection and quantification of ATP released. Figure 5 This image represents an ATP response detected by the biosensors. The top line is the response on the ATP sensor, the middle line is the response from the null sensor and the bottom line is the net response from both. The x-axis is time and the y-axis is response in picoAmps. The maximum response here occurs at around 305 seconds and is 41.5 picoAmps of ATP. Methods The basic process that was used for this experiment is relatively simple. A hypocapnic (low pCO₂), hypercapnic (high pCO₂) and a control (standard systemic pCO₂) solutions were warmed in a water bath to 37ᵒC and a pump drew up the required solution to pump it into a water bath containing a section of mouse or rat brain (300-400µm thick) and another pump would remove fluid from the opposite side of the bath to ensure a constant flow of solution across the section. Initially the hypocapnic solution was run across the section for 10 minutes to close the Cx26 channels. Hypercapnic solution containing 200µM carboxyfluorescein (fluorescent, anionic dye) was used for 5 minutes to open Cx26 channels (anionic channels) enabling dye to be taken up cells expressing Cx26. A 15 minute wash with hypocapnic solution closed the channels so Cx26 cells would retain dye and also to wash off any dye left in the water bath or loosely absorbed by the section. Fluorescent microscopy was used to identify which cells had retained dye. The sensors were then placed as close to the fluorescent cells as possible. Two sensors were used, a null (no enzyme layer) and the ATP sensor, the null should not detect a change in ATP concentration thus acting as a control. Hypercapnic solution was run across the slice to open Cx26 enabling ATP (and dye) release. Potential levels of ATP release was likely to be very small so an ATP enrichment of the cells was used, 10µM ATP was put in the dye loading (hypercapnic) solution for some experiments. A control experiment in which the same protocol was used but the sensors were removed from the section (but remained in the water bath) demonstrated that there was no ATP response when sensors are not touching the cells. After each experiment 10mM ATP solution was run through the bath to provide a calibration value for a known concentration of ATP. Figure 3 The left image is fluorescent microscopy of loaded cells, the bright cells are those which have taken up dye via Cx26 hemi-channels. The right image is a light microscope image of the same blood vessel. Figure 6 This figure represents a control experiment in which the sensors were not placed in contact with the tissue. This is why the traces all remain flat throughout until the ATP calibration at the end. The x and y-axes represent time and picoAmps from the sensor respectively. Figure 4 On the left again is a fluorescent image of loaded cells surrounding a blood vessel with a light microscope image on the right of the same vessel. This image is of the same vessel in figure 3 but deeper into the brain. Figure 7 In this figure, there is a noticeable tone. When the sensors are removed there is a change in picoAmps from the sensors suggesting that perhaps there is a basal level of ATP release in the sample.