Download
1 / 9
90 likes | 182 Views
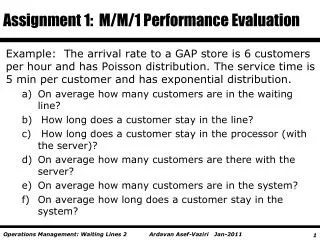
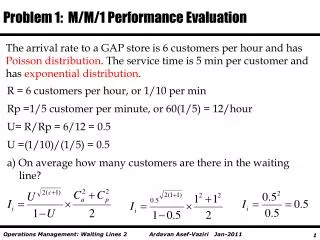
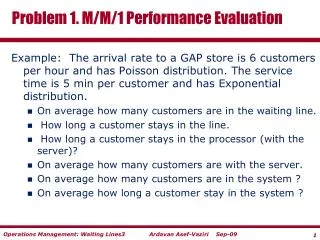
Performance Evaluation M/M/1 Analytical Method. System Arrival and Completions. 15. 14. 13. Customers in system. 12. 11. 10. 9. 8. Jobs. 7. Arrivals. 6. Completion. 5. 4. 3. 2. 1. Time. 0. 2. 4. 6. 0. Little’s Law. n(t). k. t. 0. r k.

E N D
System Arrival and Completions 15 14 13 Customers in system 12 11 10 9 8 Jobs 7 Arrivals 6 Completion 5 4 3 2 1 Time 0 2 4 6 0
Little’s Law n(t) k t 0 rk Number of customers in the black box Total time that there are k customers in the system
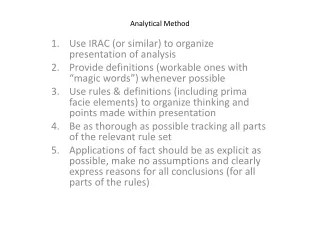
Performance Evaluation – Analytical Method (M/M/1) Arrivals (A) Completions (C) I/O IORB Time it takes to give service(S) IORB # of IORBs in the system K K+1 K-1 K Arrival Rate IORB Completion Rate Birth-Death Process (M/M/1) N = Avg # of IORB in the system The arrival of a new IORB is called a birth The completion of an IORB is called a death T Time we observe the system A # of Arrival C # of Completions S Service Time * All these when system is in steady state
Performance Evaluation – Analytical Method (M/M/1) … k-1 0 1 2 3 4 k Avg. # of IORB in the system Fraction of time server has k IORBs N 0 t rk Flow in = flow out The flow across the line to the right is the probability of being in state (k-1) times the rate at which the system transitions from state (k-1) to k The flow across the line to the left is the probability of being in state k times the avg. service rate
Performance Evaluation – Analytical Method (M/M/1) Flow out Flow in Geometric series Utilization Law
Performance Evaluation – Analytical Method (M/M/1) Avg. # of IORB’s in the system Geometric series
Performance Evaluation – Analytical Method M/M/1 Response Time Little’s Law
Performance Evaluation – Analytical Method M/M/1 Average waiting Time in queue use Average # of IORBs in queue Little’s Law