Download
1 / 18
180 likes | 324 Views
Net Revenue – Cost of Goods Sold = Gross Margin Gross Margin – Operating Expenses = Earning Before Interest and Taxes ( Ebit ) Earning Before Interest and Taxes - Interest expenses + Interest Income = Income Before Taxes Income Before Taxes + Extraordinary Items = Net Income

E N D
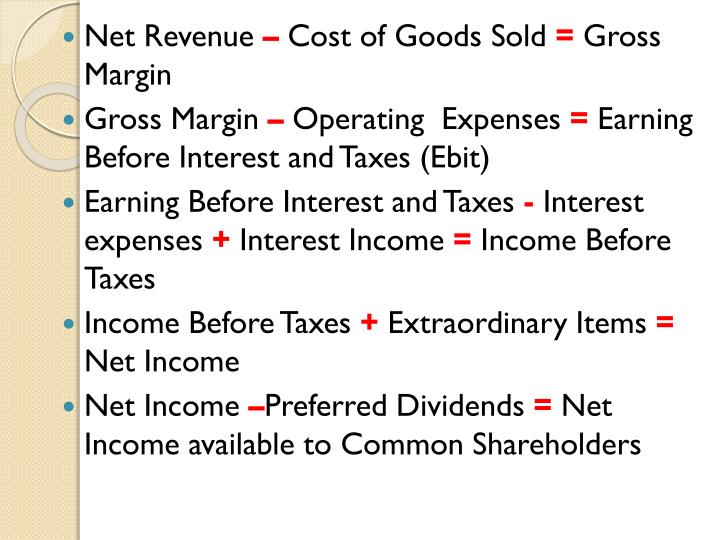
Net Revenue – Cost of Goods Sold = Gross Margin • Gross Margin – Operating Expenses = Earning Before Interest and Taxes (Ebit) • Earning Before Interest and Taxes - Interest expenses + Interest Income = Income Before Taxes • Income Before Taxes + Extraordinary Items = Net Income • Net Income –Preferred Dividends = Net Income available to Common Shareholders
Gross Profit Margins = • Gross Profit • Operating Income before Tax • EBIT • Common Shareholders / Ordinary Shareholders • Stock and Share • Diluted Earning Per Share • Other Comprehensive Income • Change in Unrealized Gain on Investments, Net of tax • Foreign Currency Translation Adjustment • Net Unrealized Gain on Derivatives Instruments Net of taxes
Derivatives Instruments • A security whose price is dependent upon or derived from one or more underlying assets. The derivative itself is merely a contract between two or more parties. Its value is determined by fluctuations in the underlying asset. The most common underlying assets include stocks, bonds, commodities, currencies, interest rates and market indexes. Most derivatives are characterized by high leverage.
Derivatives Instruments • Futures contracts, forward contracts, options and swaps are the most common types of derivatives. Derivatives are contracts and can be used as an underlying asset. There are even derivatives based on weather data, such as the amount of rain or the number of sunny days in a particular region.
Derivatives Instruments Derivatives are generally used as an instrument to hedge risk, but can also be used for speculative purposes. For example, a European investor purchasing shares of an American company off of an American exchange (using U.S. dollars to do so) would be exposed to exchange-rate risk while holding that stock. To hedge this risk, the investor could purchase currency futures to lock in a specified exchange rate for the future stock sale and currency conversion back into Euros.
Net Payoff • Dirty Surplus Accounting • Clean Surplus Accounting
Measurement in the financial statements • Value of Equity = Value of Firm – Value of Debt • Intrinsic Premium = Intrinsic Value of Equity – BV of Equity • Market Premium = Market Price of Equity – Book Value of Equity • Price to Book Ratio • Market to Book Ratio • Intrinsic Price to Book Ratio
Measurement in the balance Sheet • Mark to Market Accounting • Cash & Cash Equivalent (Fair Value) • Short Term Investment & Marketable Securities (Fair Value) • Receivables (Quasi Fair Value) • Inventories (Lower of Cost or Market Value) • Short Term payable & Long Term Borrowing (fair value) • Other Intangible Assets – Knowledge Assets, Brand asset (Not Recorded) • Commitments & Contingencies FASB#5 (Many Not Recorded) Law Suits, Product Warrantees, Guarantees,
Measurement in the balance Sheet • Historical Cost Accounting • Long Term Tangible Assets (Historical Cost) • Recorded Intangible Assets (Copy Right, Patent) • Goodwill (Diff between purchase price FASB # 142) • Long Term Debt Securities (Some at fair Value) FASB #115 • Investment Held for actives trading (Fair Market value) • Investment Available for sales (Fair market Value) • Investment Held to maturity (Historical Cost) • Equity Investments (Minority Interest)
MODELS BASED ON P/E RATIO • PRICE-EARNINGS RATIO MODEL • Many investors prefer the earnings multiplier approach since they feel they are ultimately entitled to receive a firm’s earnings
MODELS BASED ON P/E RATIO • PRICE-EARNINGS RATIO MODEL • EARNINGS MULTIPLIER: = PRICE - EARNINGS RATIO = Current Market Price following 12 month earnings
P/E ratio • Widely used stock measure • Definition: P/E = Price (in dollars /share) divided by Earnings (in dollars/share) • Example: ExxonMobil (XOM) costs $84.26/share and earned $6.80/share. • P/E = $84.26/$6.80 = 12.4 • Often called “Price Multiple” or “Earnings Multiple” • Used for valuing and comparing stocks
Which P/E did you have in mind? • There are lots of definitions, and they are different • What share price to use? Which earnings to use? • What’s a good P/E? • How do I know if a P/E is too high, low, or just right? • How do I use it?
Two Main Types of P/E • P/E (Trailing Earnings) • Definition: Current Price / Last 12 months of Earnings • Also called P/E TTM (Trailing Twelve Month) • Fairly objective: based on measured actual data • Ignores likely near-term events and performance • Tends to be higher (current price/previous earnings) • P/E (Forward Earnings) • Definition: Current Price / Forecast next 12 months Earnings • Also called Future P/E, Estimated P/E, Forward P/E, etc. • Subjective: depends on analyst estimates • Incorporates likely near-term events and performance • Tends to be lower (current price/future earnings)
Using the P/E • P/E normalizes price and earnings, allowing direct comparison • Both Earnings and Price vary widely over time for a single stock and between different stocks • How would you like to price apples? Dollars per basket? Or dollars per Kg? • Compare a stock to… • its history • its future • its close peers • its industry • the market • Compare the entire market to reality
Articulation of the Financial Statements • Financial statement interrelationships • Articulation—logical relationships among financial statements’ accounts as the four financial statements work as an integrated reporting system to convey financial information
Articulation of Financial Statements • Financial statements are linked within and across time – they articulate. • Balance sheet and income statement are linked via retained earnings. • Absent of equity transactions such as stock issuances and purchases and dividend payments, the change in stockholders’ equity equals the income or loss for the period.
Articulation of Financial Statements Income Statement +Revenues -Expenses = Net Income Balance Sheet Assets = Liabilities + Shareholders’ Equity • Statement of Shareholders’ Equity • Beginning Balance • +Capital Increased • + Net Income • Dividends Paid • +- Other Transactions • Ending Balance Cash Flows +-Operating + -Investing +-Financing Change in Cash Beginning Balance Ending Balance