Download
1 / 30
320 likes | 713 Views
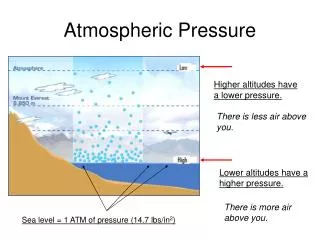
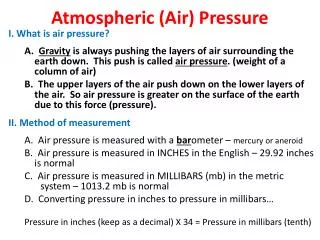
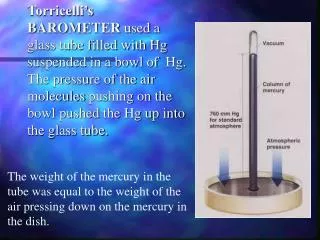
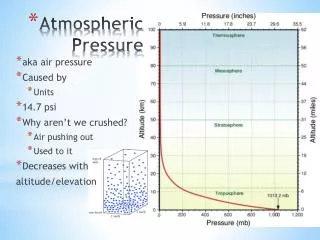
Atmospheric Pressure. Air Pressure - the weight of the air above a given level. * Standard sea level pressure is 29.92” of Mercury (Hg) or 1013.25 millibars (mb) The highest recorded atmospheric pressure: 1086 mb or 32.06” Hg, (at Tosontsengel, Mongolia, 19 Dec. 2001)

E N D
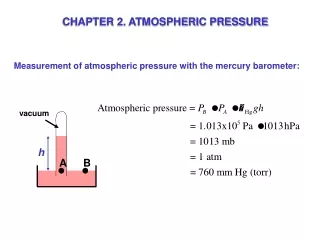
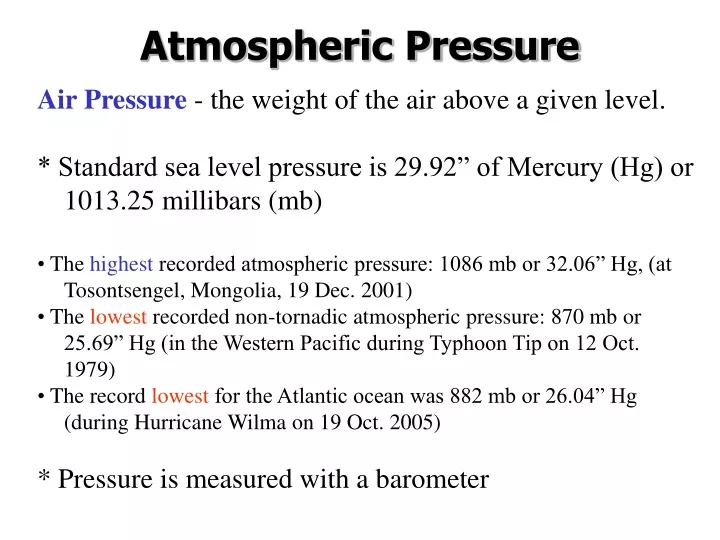
Atmospheric Pressure • Air Pressure - the weight of the air above a given level. • * Standard sea level pressure is 29.92” of Mercury (Hg) or 1013.25 millibars (mb) • The highest recorded atmospheric pressure: 1086 mb or 32.06” Hg, (at Tosontsengel, Mongolia, 19 Dec. 2001) • The lowest recorded non-tornadic atmospheric pressure: 870 mb or 25.69” Hg (in the Western Pacific during Typhoon Tip on 12 Oct. 1979) • The record lowest for the Atlantic ocean was 882 mb or 26.04” Hg (during Hurricane Wilma on 19 Oct. 2005) • * Pressure is measured with a barometer
At the surface... Lines of equal pressure = isobars Pressure at all stations have been reduced to sea level to remove the effect of topography. Near the surface, the pressure decreases on average by ~10mb / 100m
At the surface… highs and lows * Air in high pressure systems (anticyclones) blow clockwise in the Northern Hemisphere
At the surface… highs and lows * Air in low pressure systems (mid-latitude cyclones) blow counterclockwise in the Northern Hemisphere
Surface Weather Map Constant height surface with variations in pressure
Atmospheric Pressure In the upper air... The upper air charts show variations in height along a constant pressure surface (isobaric maps) Lines of equal height =contour lines For example… using the 500 mb pressure, how does the height of this pressure vary in the atmosphere?
Cool the air over City 1 Warm the air over City 2 Thickness of atmospheric column varies with temperature.
0 mb 0 mb 500 mb 500 mb 1000 mb 1000 mb Ht = 18,000 ft Ht = 19,500 ft
Height of the Air Column Depends on temperature!
Upper Air Charts (Maps) * Maps are produced at many standard levels… such as 900 mb, 850 mb, 700 mb, 500 mb, 300 mb and 200 mb. * Ridge - an elongated area of high pressure * Trough - an elongated area of low pressure
Upper Air Chart (500 mb) Trough Ridge
Why Winds Blow Need to examine the forces that affect the horizontal movement of air. 1. Pressure Gradient Force 2. Coriolis Effect 3. Friction Pressure Gradient Force (PGF) * Pressure difference creates a force: PGF * Due to the PGF, air moves from higher to lower pressure
0 mb 0 mb 1000 mb 1000 mb
0 mb Surface heating generates low pressure Surface cooling generates high pressure 0 mb 500 mb X X 400 mb 600 mb 500 mb 1004 mb 1000 mb 1000 mb 996 mb H L
Pressure Gradient Force (PGF) * Pressure gradient force = difference in pressure divided by distance. PGF = DP / n * The PGF is directed at right angles to the isobars.
* Closely spaced isobars = steep pressure gradient = strong winds * Widely spaced isobars = gentle pressure gradient = light winds
Pressure Gradient Force (PGF) Wind flow if PGF were the only force…out from the high and directed straight to the low
Coriolis Effect * An apparent force that is due to Earth’s rotation. * Causes objects (ocean currents, aircraft, artillery projectiles and air molecules) to be deflected from their path of motion. * Speed of rotation of the earth’s surface changes as we move latitudinally: - speed increases moving equatorward. * Merry-Go-Round Example
Coriolis Effect * Direction of wind deflection: to the right in the Northern Hemisphere to the left in the Southern Hemisphere * Amount of deflection depends on: 1. rotation of the Earth 2. the latitude 3. the object’s speed (velocity) * Coriolis effect acts at right angles to the wind, only influencing wind direction and never wind speed.
GEOSTROPHIC WINDS (Upper level winds) Wind that flows parallel to contours & straight flow Results from a balance between PGF & Coriolis This occurs above 3000 ft (1000 meters)
GRADIENT WINDS (Upper level winds) Air flow around a curved surface * Cyclonic Flow - air flow in a counter- clockwise direction around a low pressure system * Anticyclonic Flow - air flow in a clockwise direction around a high pressure system * Wind flow around “L” or “H” is accelerating so it has Centripetal Force acting on it.
GRADIENT WINDS (Upper level winds) Wind flow if PGF, Coriolis, & Centripetal were the only forces…parallel to the contours = Gradient Wind.
Summary of Upper Level Winds Wind flow if PGF and Coriolis were the only forces…parallel to the contours = straight flow = GEOSTROPHIC WINDS Wind flow if PGF, Coriolis, & Centripetal forces…parallel to the contours = curved flow = GRADIENT WINDS